Informative vs uninformative prior distributions with characteristic curve linking methods
Brandon LeBeau, Keyu Chen, Wei Cheng Liu, and Aaron McVay
University of Iowa
Linking overview
- With item response theory (IRT), the ability scale is arbitrarily defined (commonly mean of 0 and sd of 1).
- Linking is useful to help place individual ability and IRT item parameters on the same scale.
- Particularly when two forms are administered to non-equivalent groups.
- Four linking methods are common:
- Mean/Mean
- Mean/Sigma
- Haebara
- Stocking Lord
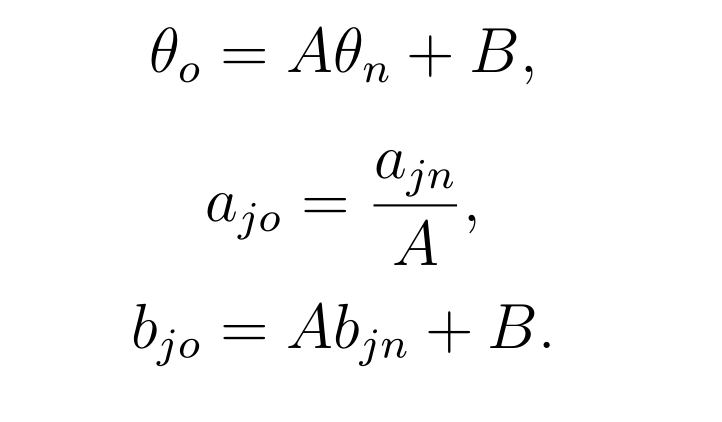
Linking Transformation
Linking Designs
- Random Groups
- Single group with counterbalancing
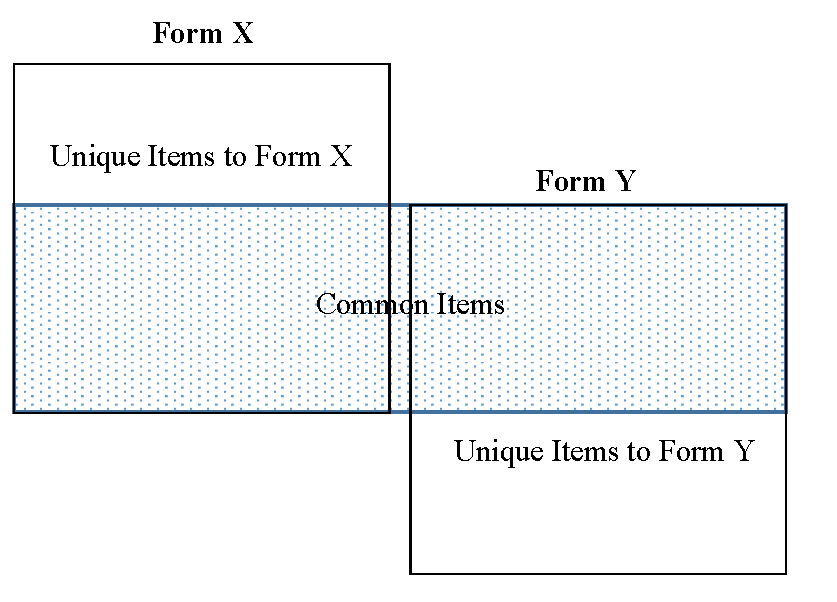
- Common-item nonequivalent group design
- More details in Kolen & Brennan (2014).
Common-item NEG Design
Prior Weights
- The proficiency points and weights can be specified to reflect the ability distribution of the original scale.
- In addition, proficiency points and weights can be specified to reflect the ability distribution of the new scale.
- More details are provided in Kim & Lee (2006).
Research Questions:
- To what extent does the prior distribution have an impact on the estimation of the transformation constants?
- To what extent does the relationship from #1 generalize across the simulation conditions?
Simulation Design
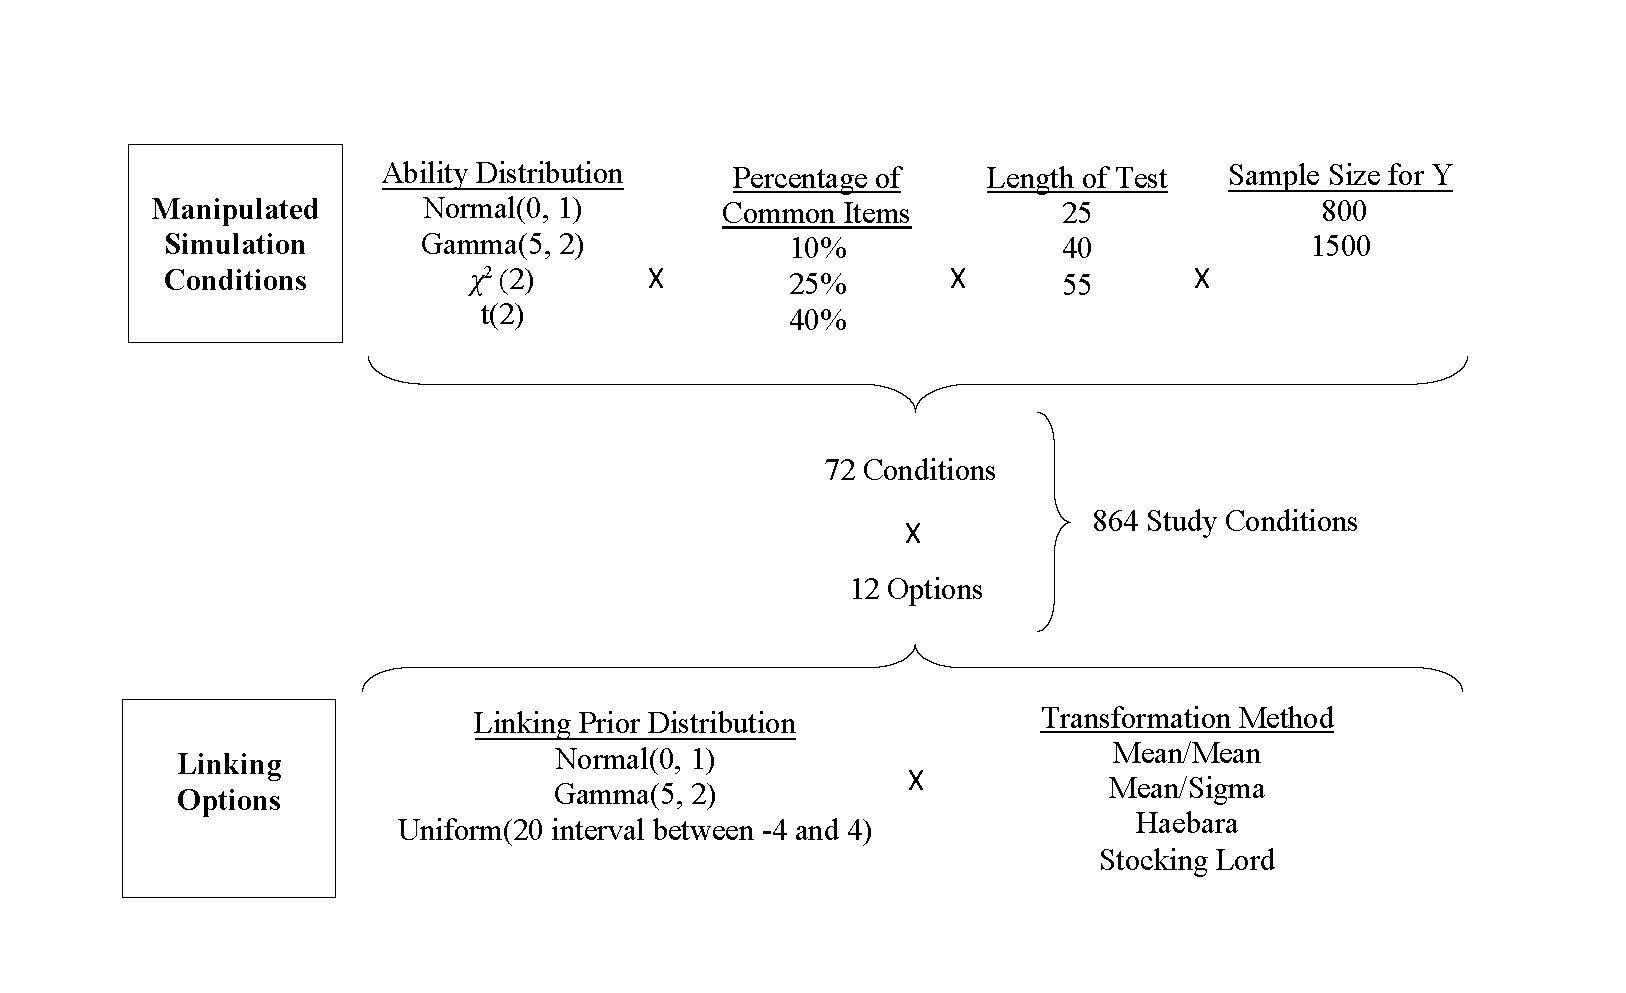
Simulation Design 2
- The A and B transformation constants were also simulated as a part of the design.
- This was done in an attempt to increase generalizeability of study results.
- Both were simulated from a random uniform distribution.
- A ranged from 0.5 to 1.5 rounded to nearest .05 (21 possibilities)
- B ranged from -2 to 2 rounded to nearest 0.10 (41 possibilities)
- 1000 replications
Simulation Procedures
- A population of 55 items were simulated as Form X from a normal ability distribution.
- Form Y consisted of common items from Form X (transformed based on A and B parameters).
- Additional items were simulated to fill out Form Y.
- Form Y was calibrated with Bilog-MG using a 3PL IRT model.
- Transformation constants were computed from calibrated Form Y item parameters and population Form X item parameters.
- An R package, plink, was used.
Study Outcomes
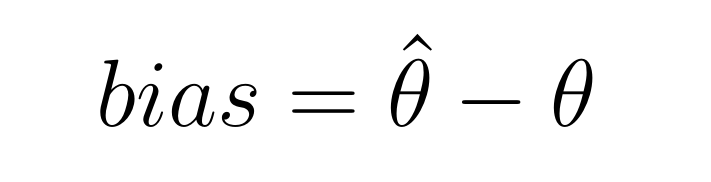
- Bias in the transformation constants (A and B) were explored descriptively and inferentially:
Simulation recovery
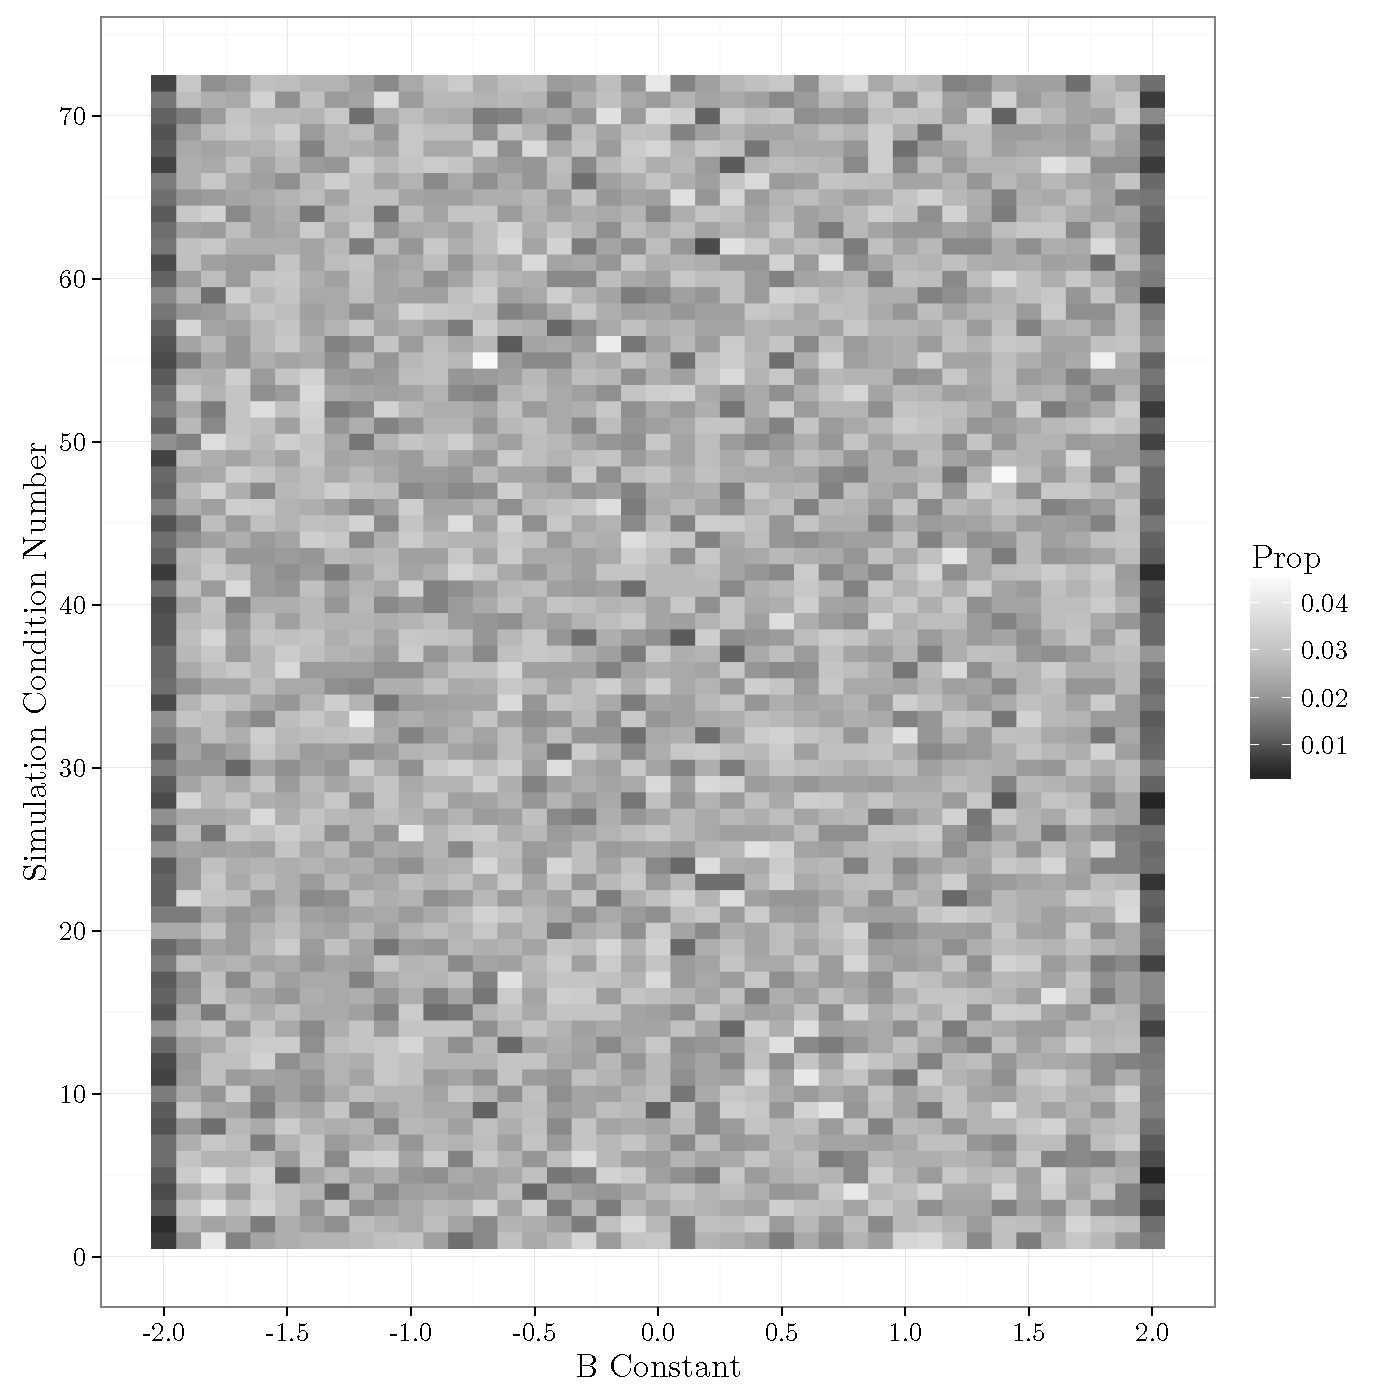
Results
| Variable | Eta A | Eta B |
|---|---|---|
| Ability Dist | 0.699 | 0.013 |
| Prior Dist | 0.012 | 0.009 |
| A Pop | 0.149 | NA |
| B Pop | 0.012 | 0.522 |
| Ability Dist:Prior Dist | 0.004 | 0.003 |
| Ability Dist:A Pop | 0.045 | NA |
| Ability Dist:B Pop | 0.008 | 0.387 |
| Prior Dist:A Pop | 0.004 | 0.002 |
| Ability Dist:Prior Dist:B Pop | 0.002 | 0.002 |
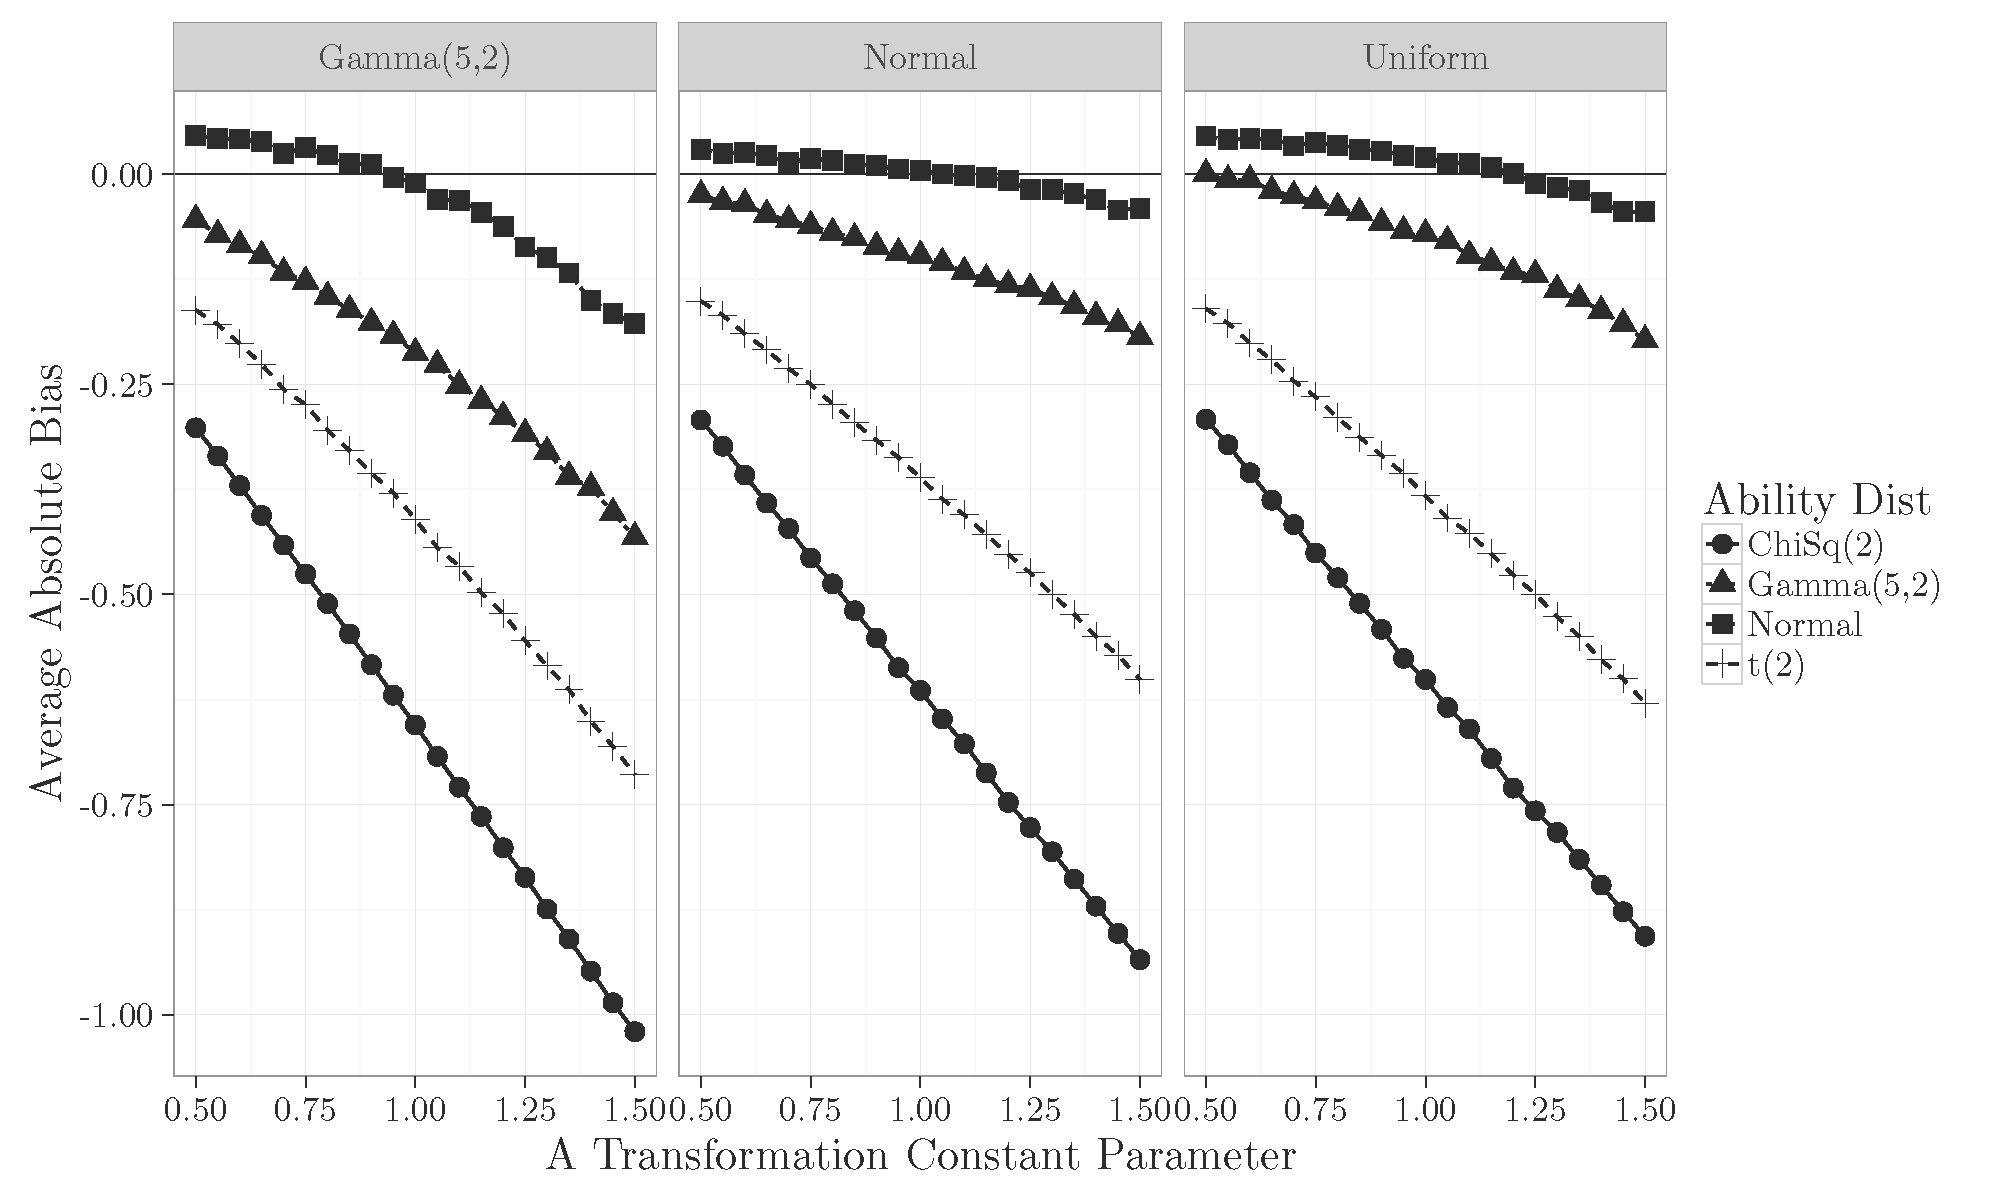
Results A Constant
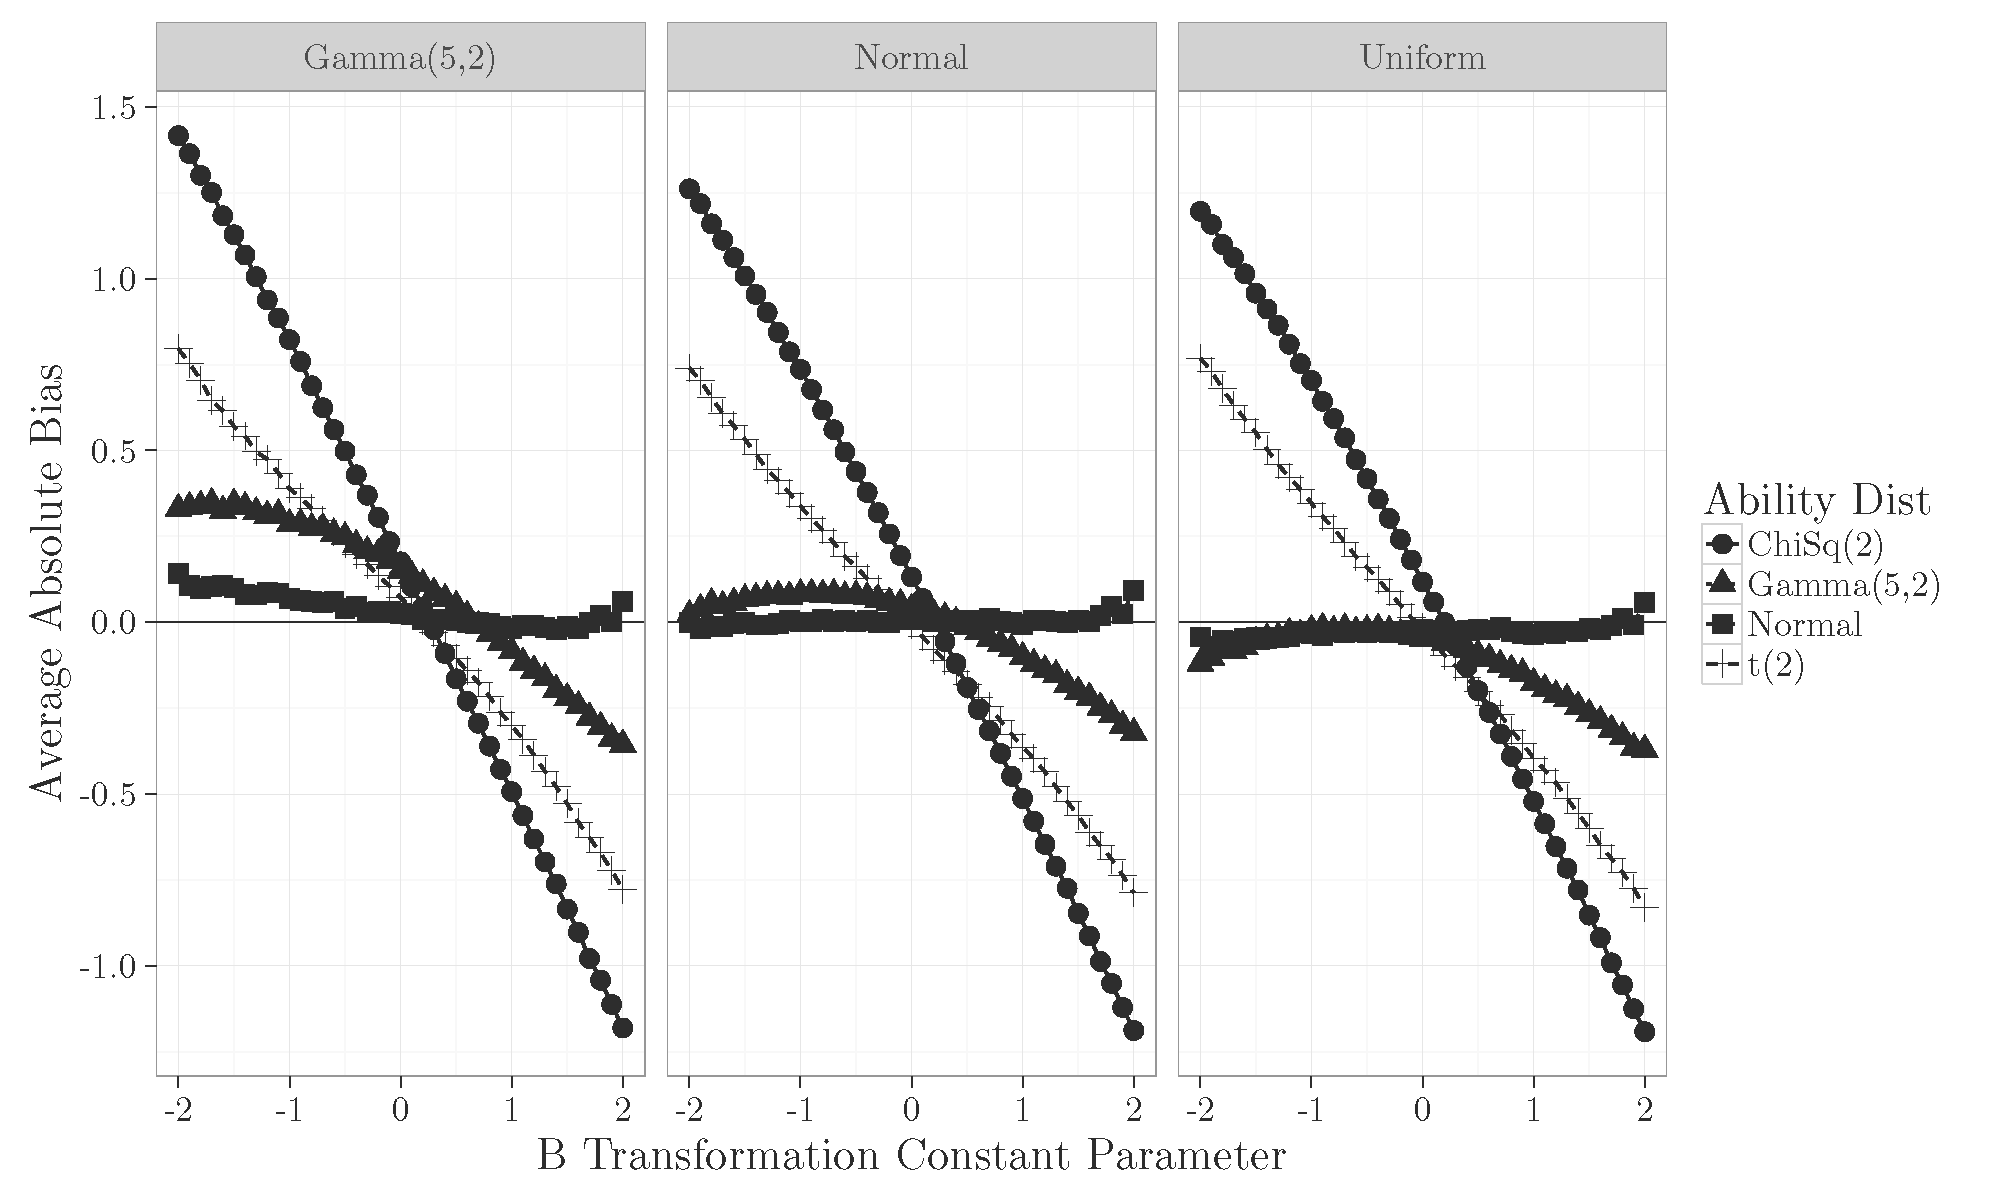
Results B Constant
Conclusions
- Prior distribution used for linking the two forms does not have a large impact on the estimation of the A and B constants.
- Even correctly specifying the shape of the ability distribution through the weights does not help with non-normal ability distributions.
- The ability distribution shape has the most impact on accurate estimation of the A and B constants.
- Normalizing transformations of the ability distribution may be helpful to limit bias when estimating these linking constants.
Questions?
- Twitter: @blebeau11
- Website: http://brandonlebeau.org
http://www2.education.uiowa.edu/directories/person?id=bleb - Slides: http://brandonlebeau.org/2016/04/08/aera2016.html
Informative vs uninformative prior distributions with characteristic curve linking methods
Brandon LeBeau, Keyu Chen, Wei Cheng Liu, and Aaron McVay
University of Iowa