Evolution of Statistical Software and Quantitative Methods
Brandon LeBeau & Ariel M. Aloe
University of Iowa
Rationale
- Extension of work done by Robert Muenchen (http://r4stats.com/articles/popularity/).
- Focus is on statistical software
- Addition of quantitative methods
- Particularly interested in the interaction.
- Questions of Interest:
- Exploring which software is popular in published research.
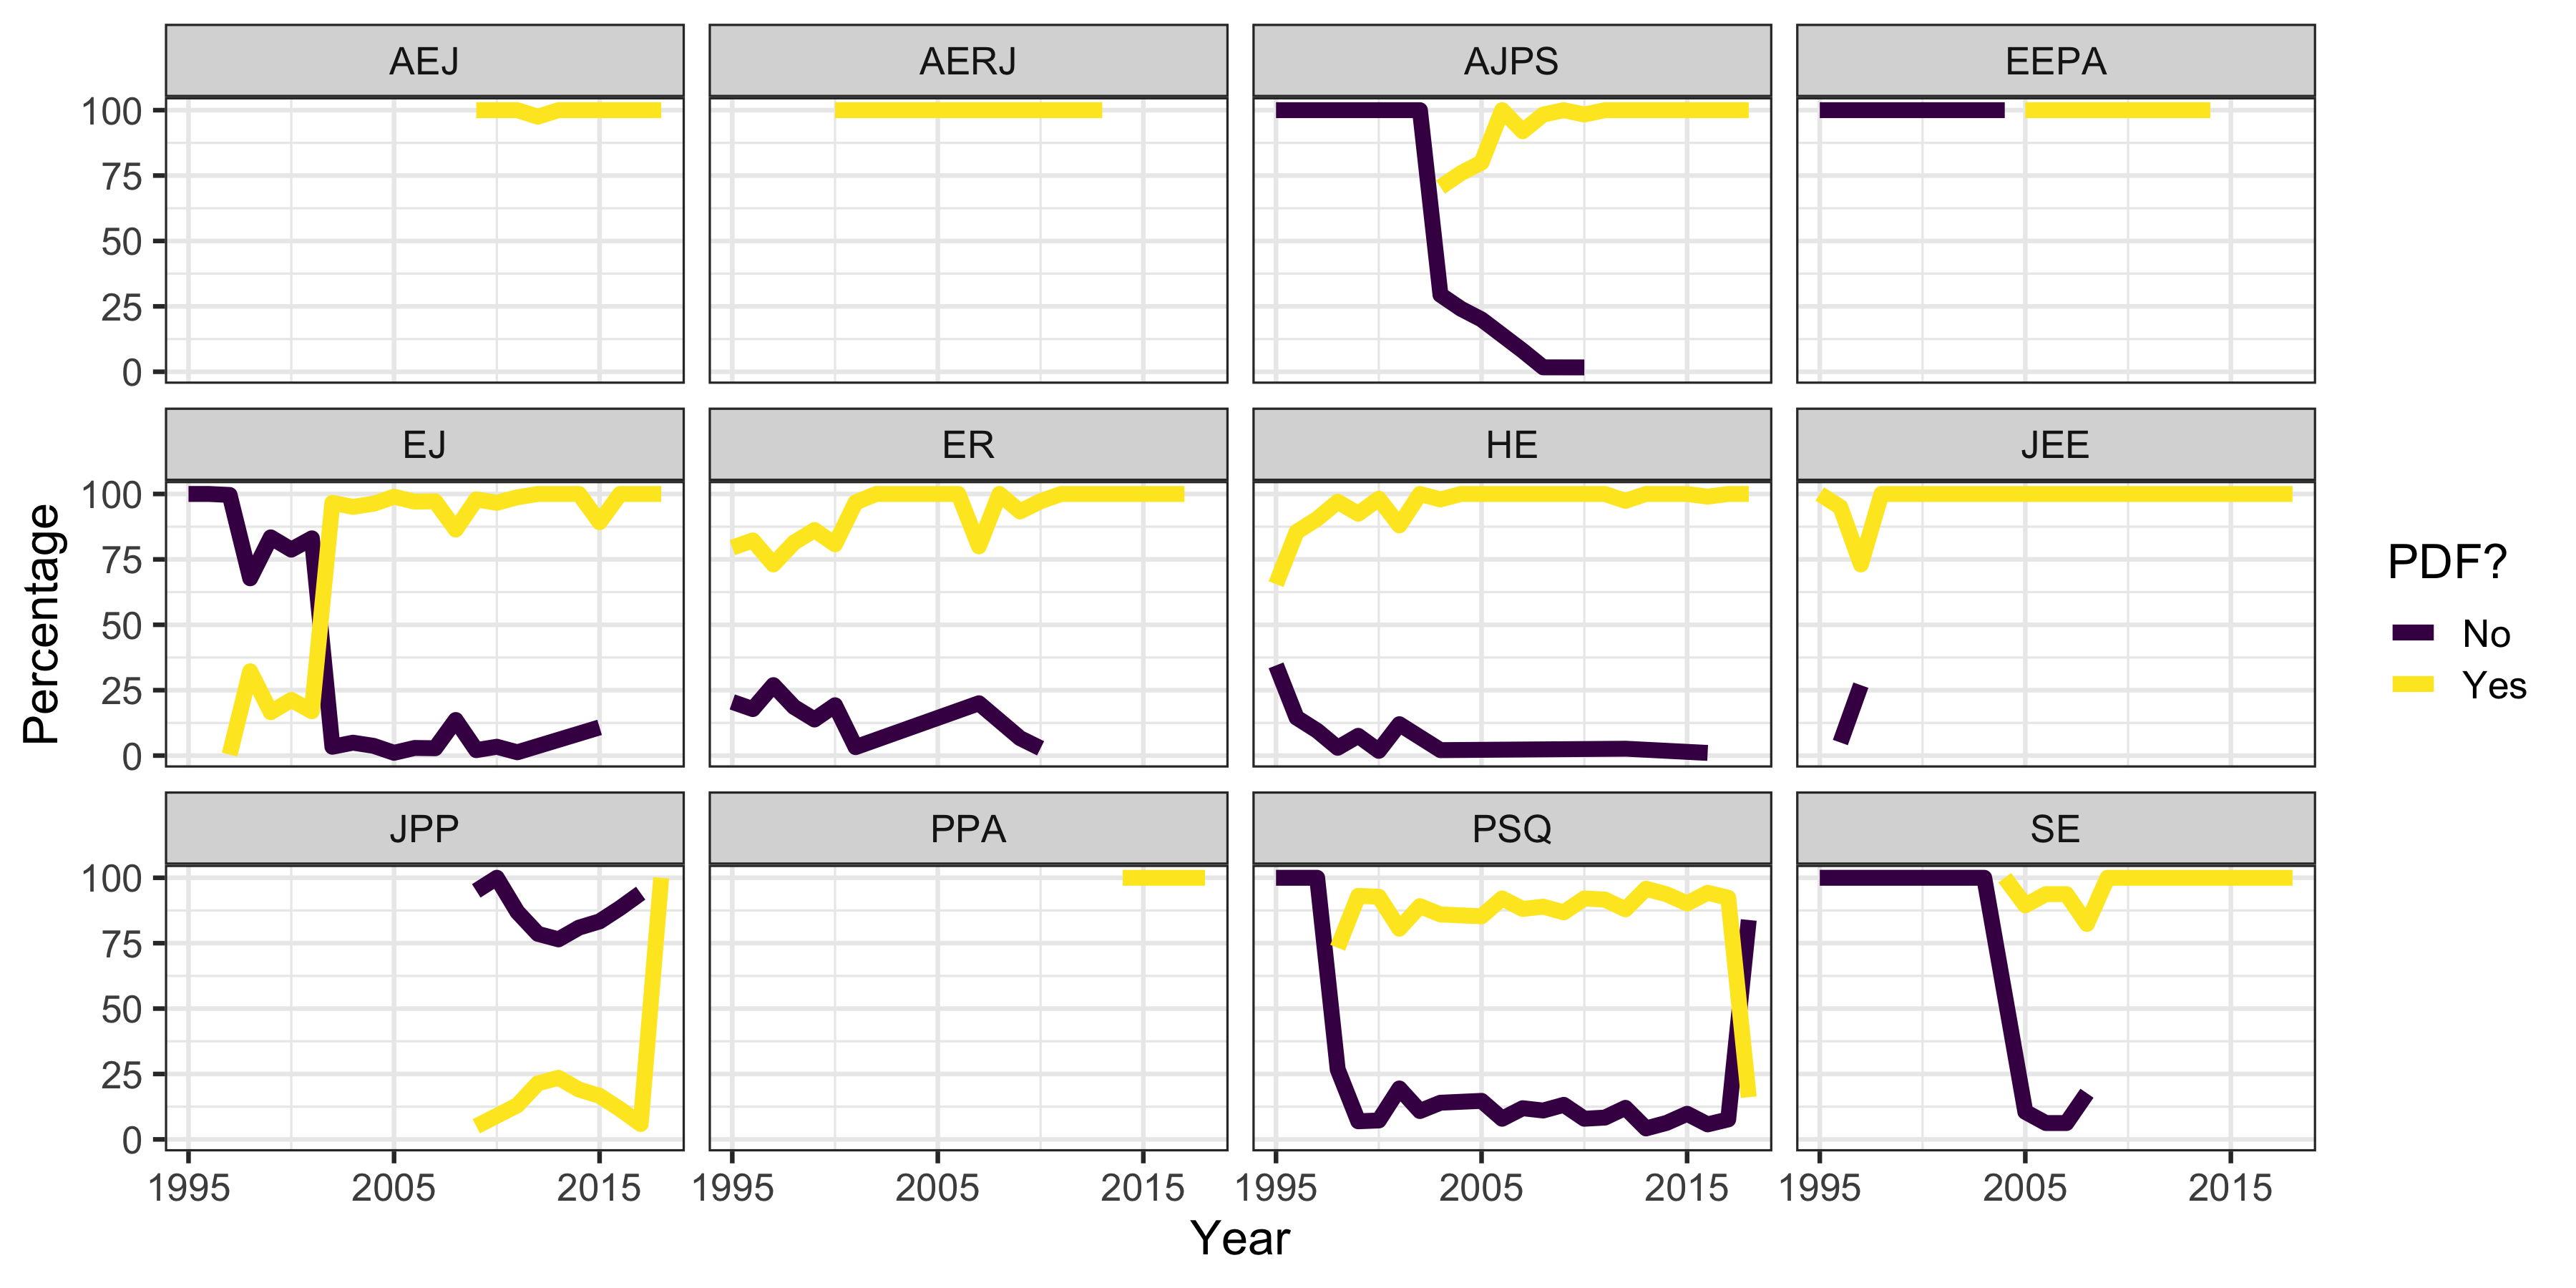
- How many empirical analyses cite software?
- Any patterns in software use with quantitative methods?
Methods
- Research synthesis methods were used
- Web of Knowledge was used to pull in citations for 12 social science journals
- 1995 to 2018
- EndNote's "Find Text" feature was used to pull in PDFs of all articles from the journals
pdfsearchR package was used to perform keyword searching.
pdfsearch
- Converts lines of text into sentences
- Removes multiple columns into a single column
- Identifies location of keyword found within document.
pdfsearch
- Short live code demo
Software Keywords
| Keyword Group | Keywords |
|---|---|
| AMOS | AMOS |
| IRT | BILOG; BILOG-MG; IRT PRO; MULTILOG; PARSCALE |
| R | CRAN; R-project; R Project; R Core Team; R software; RStudio |
| HLM | HLM [0-9]; HLM[0-9] |
| Java | Java |
| SAS | SAS; SAS Institute; JMP |
| LISREL | LISREL |
| Mplus | Mplus; M-Plus |
| Python | Python |
| SPSS | SPSS; SPSS Statistics |
| STATA | STATA |
| Other | Matlab; Scala; Systat; Statistica; Tableau; Minitab |
Method Keywords
| Keyword Group | Keywords |
|---|---|
| ANOVA | Analysis of Variance; ANOVA; Analysis of Covariance; ANCOVA; MANOVA; Multivariate Analysis of Variance; Repeated Measures Analysis of Variance; RM-ANOVA |
| IRT | IRT; Item Response Theory |
| CFA | CFA; Confirmatory Factor Analysis |
| Chi-Square | Chi-square( analysis)?; Nonparametric Analysis |
| Cluster Analysis | Cluster Analysis; Hierarchical Cluster Analysis |
| t-test | Dependent Samples t-test; one-sample t-test; two-sample t-test |
| EFA | EFA; Exploratory Factor Analysis |
| GAM | GAM; Generalized additive models |
Method Keywords Continued
| Keyword Group | Keywords |
|---|---|
| Linear Mixed Model | LMM; HLM; Multilevel Model; Multi-level Model; Hierarchical Linear Model; General(ized)? Linear Mixed Model |
| Linear Model | Linear Regression; Multiple Linear Regression; Multiple Regression; General(ized)? Linear Model |
| Growth | Growth Model; Latent Growth Model; LGM |
| SEM | Latent Variable Modeling; SEM; Structural Equation Modeling |
| Logistic Regression | Logistic Regression; Multinomial Regression; Multinomial Logistic Regression; Ordinal Regression |
| meta-analysis | meta-analysis; meta analysis |
| Non-Linear Regression | Non-Linear Regression; Nonlinear Regression |
| Propensity Score | Propensity Score Analysis; Propensity score matching |
Journals Sampled
- American Economic Journal (AEJ)
- American Educational Research Journal (AERJ)
- American Journal of Political Science (AJPS)
- Economic Journal (EJ)
- Educational Evaluation and Policy Analysis (EEPA)
- Educational Researcher (ER)
- Higher Education (HE)
- Journal of Experimental Education (JEE)
- Journal of Public Policy (JPP)
- Political Science Quarterly (PSQ)
- Public Policy Administration (PPA)
- Sociology of Education (SE)
How many articles obtained?
Software Counts
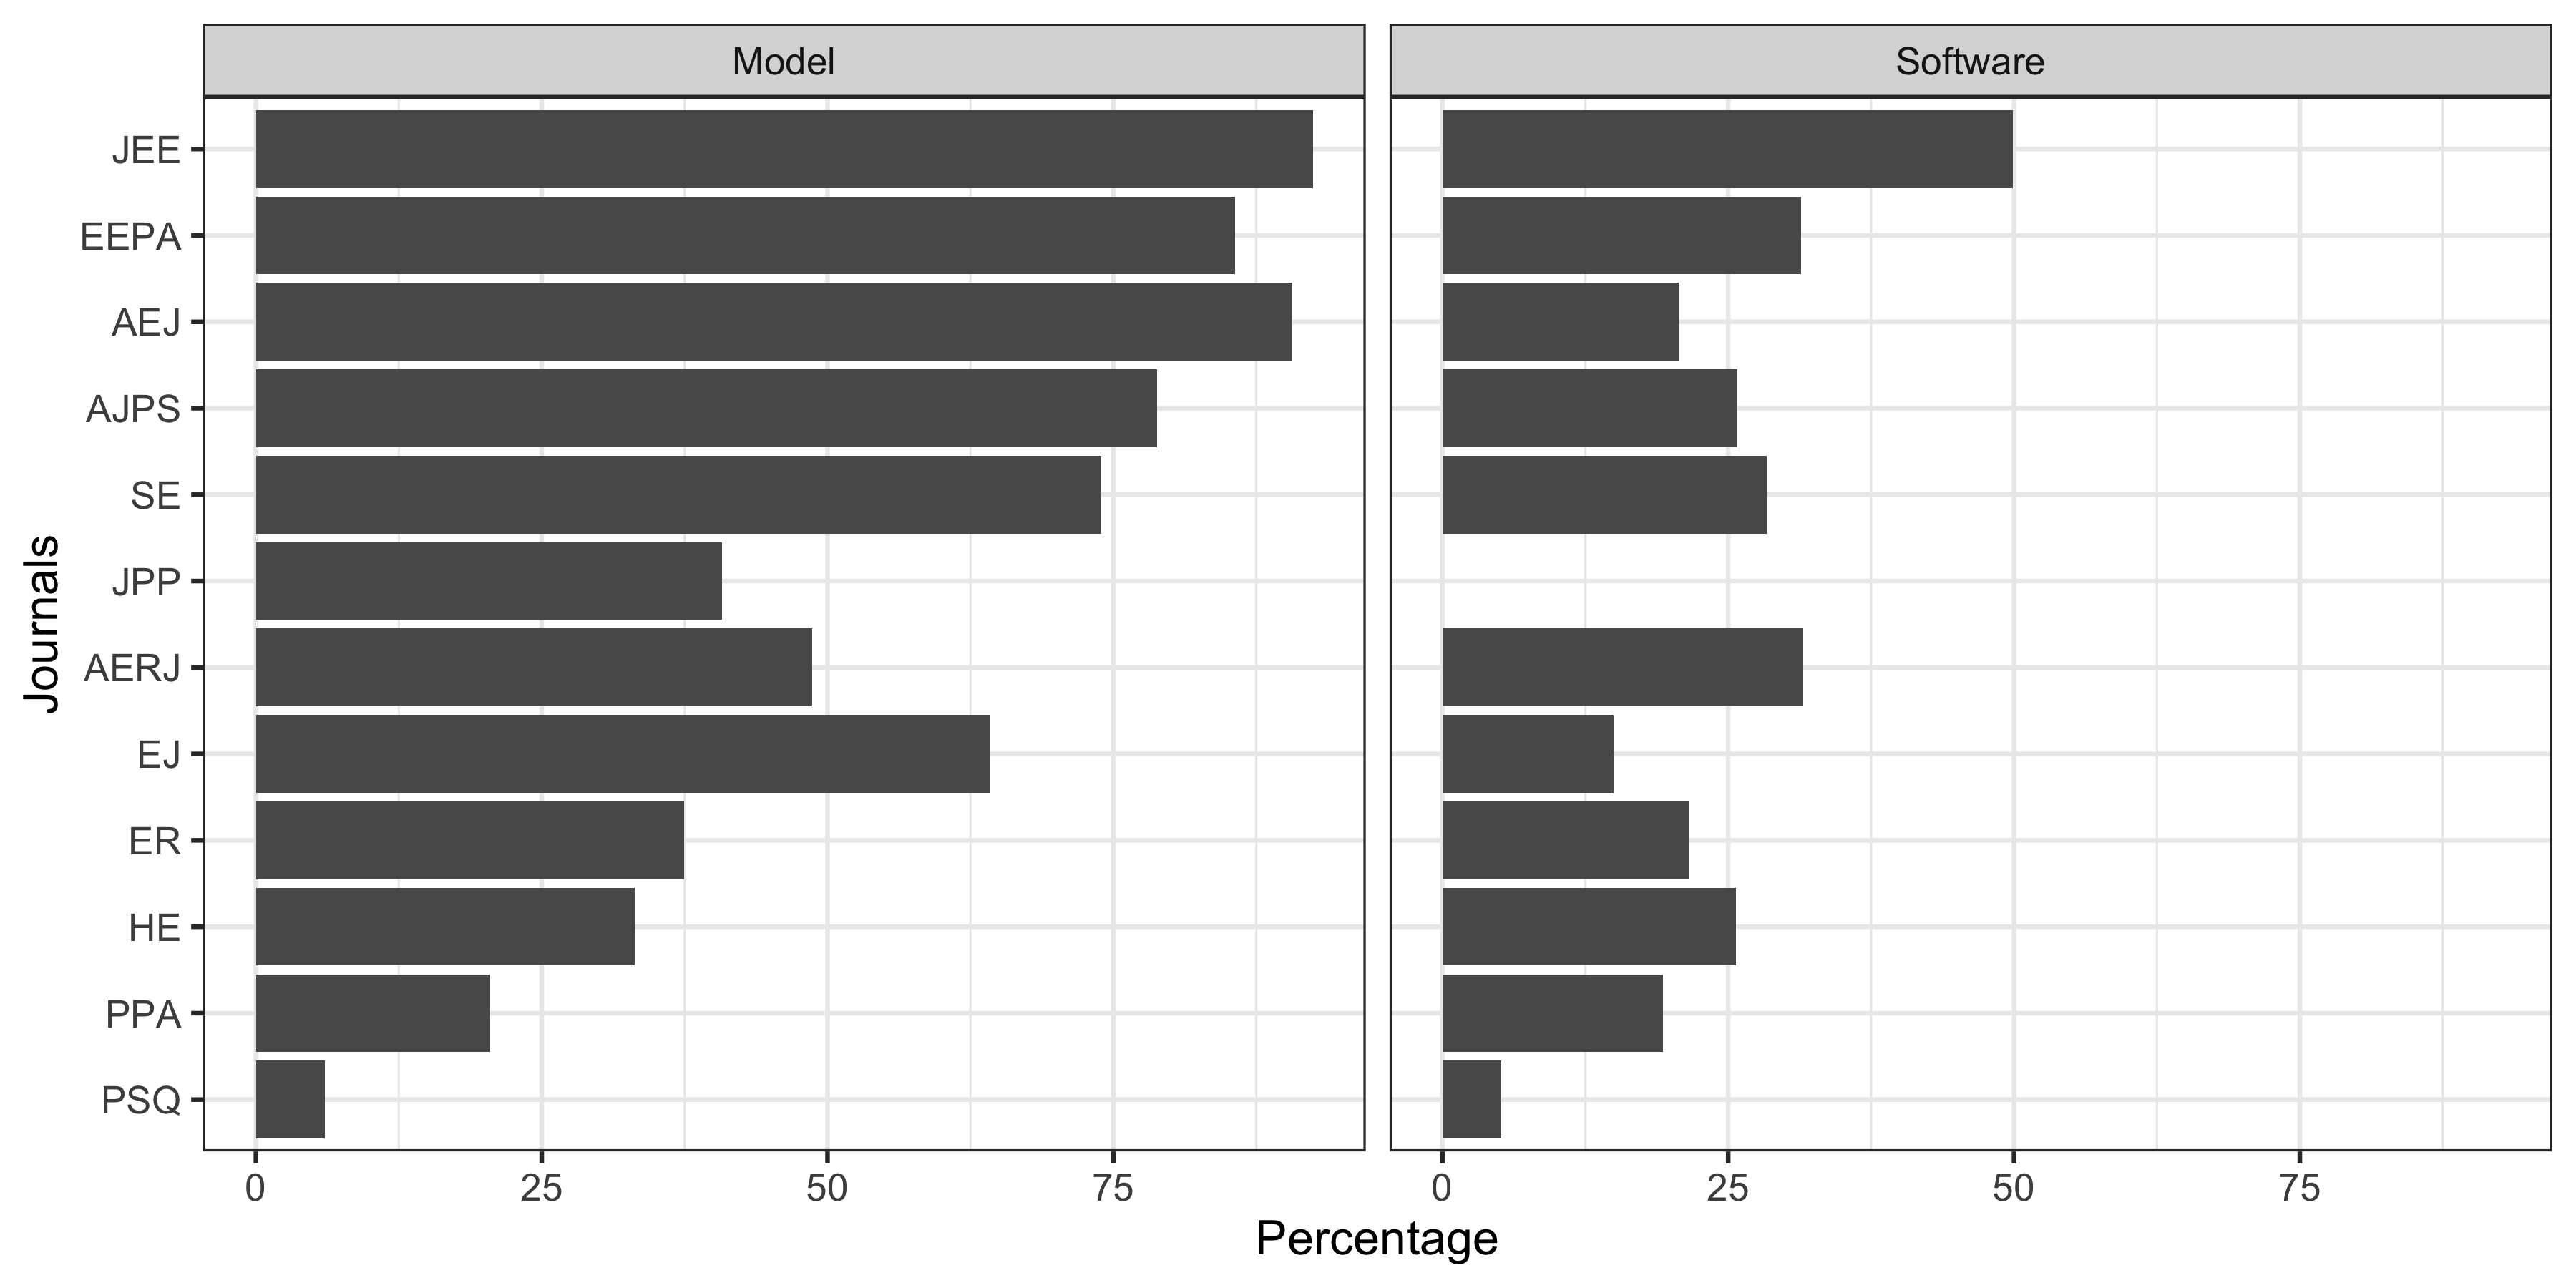
Software Keywords by Discipline
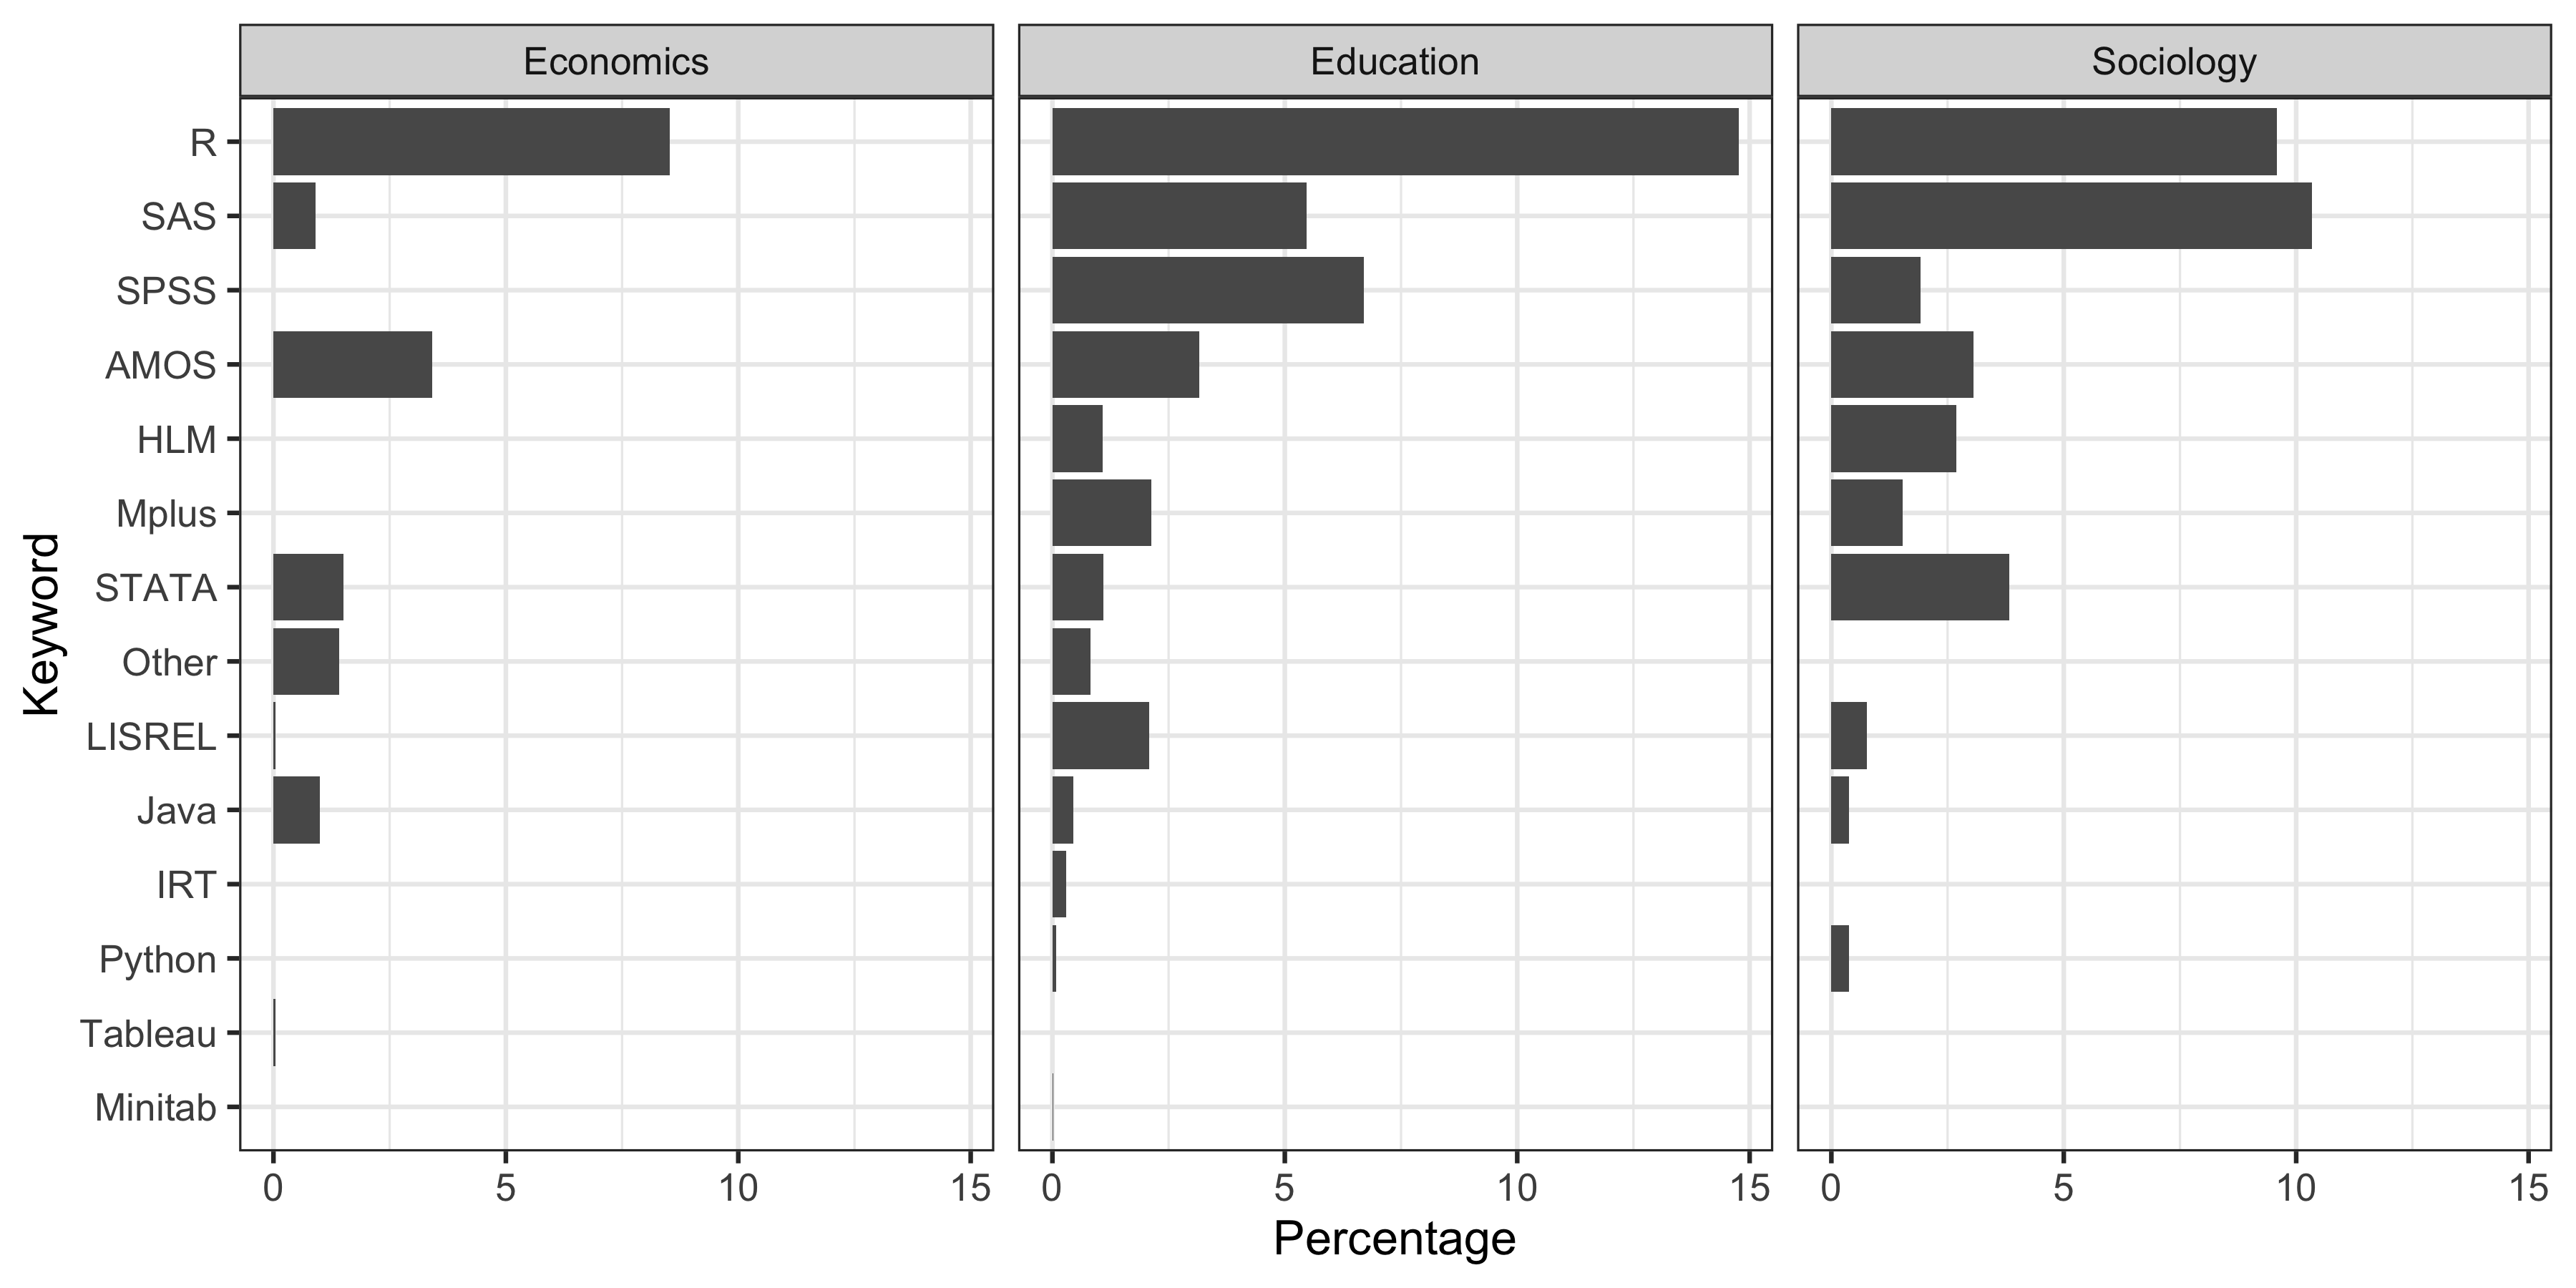
Number of software keywords
| Discipline | Avg Keywords | Min Keywords | Max Keywords | Prop. Uniq |
|---|---|---|---|---|
| Economics | 1.08 | 1 | 3 | 0.16 |
| Education | 1.67 | 1 | 7 | 0.21 |
| Political Science | 1.14 | 1 | 4 | 0.10 |
| Public Policy | 1.00 | 1 | 1 | 0.19 |
| Sociology | 1.22 | 1 | 6 | 0.28 |
Analysis keywords
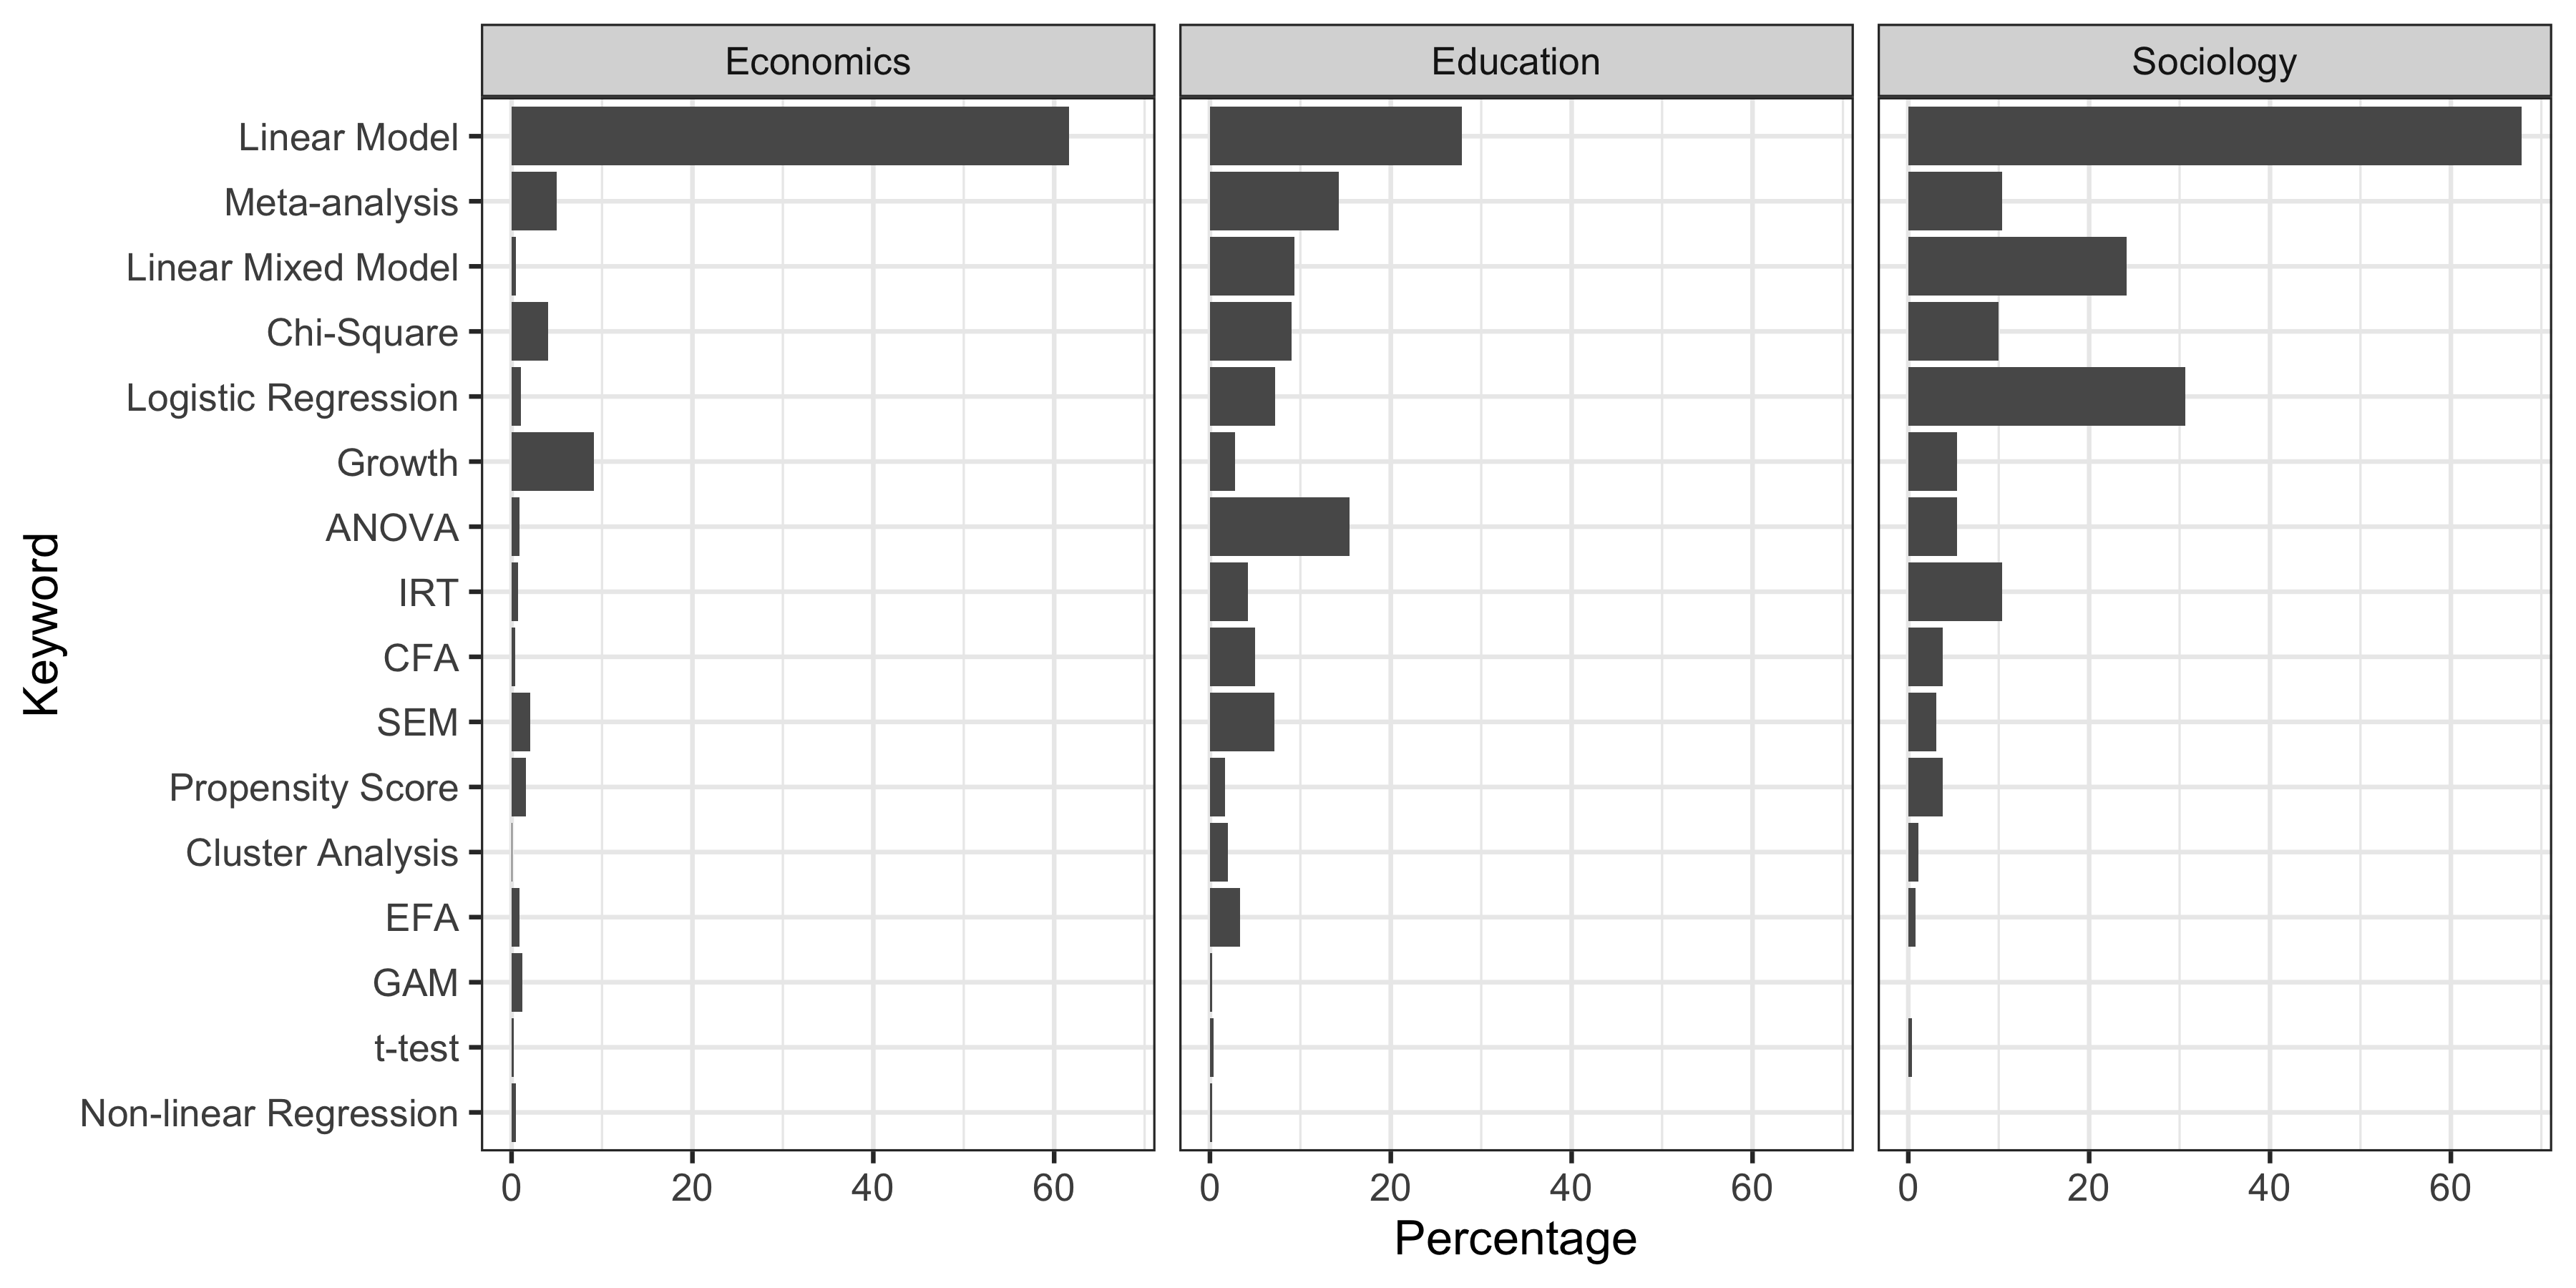
Number of analysis keywords
| Discipline | Avg Keywords | Min Keywords | Max Keywords | Prop. Uniq |
|---|---|---|---|---|
| Economics | 1.38 | 1 | 4 | 0.59 |
| Education | 3.36 | 1 | 12 | 0.27 |
| Political Science | 1.62 | 1 | 5 | 0.23 |
| Public Policy | 1.43 | 1 | 4 | 0.25 |
| Sociology | 2.39 | 1 | 7 | 0.74 |
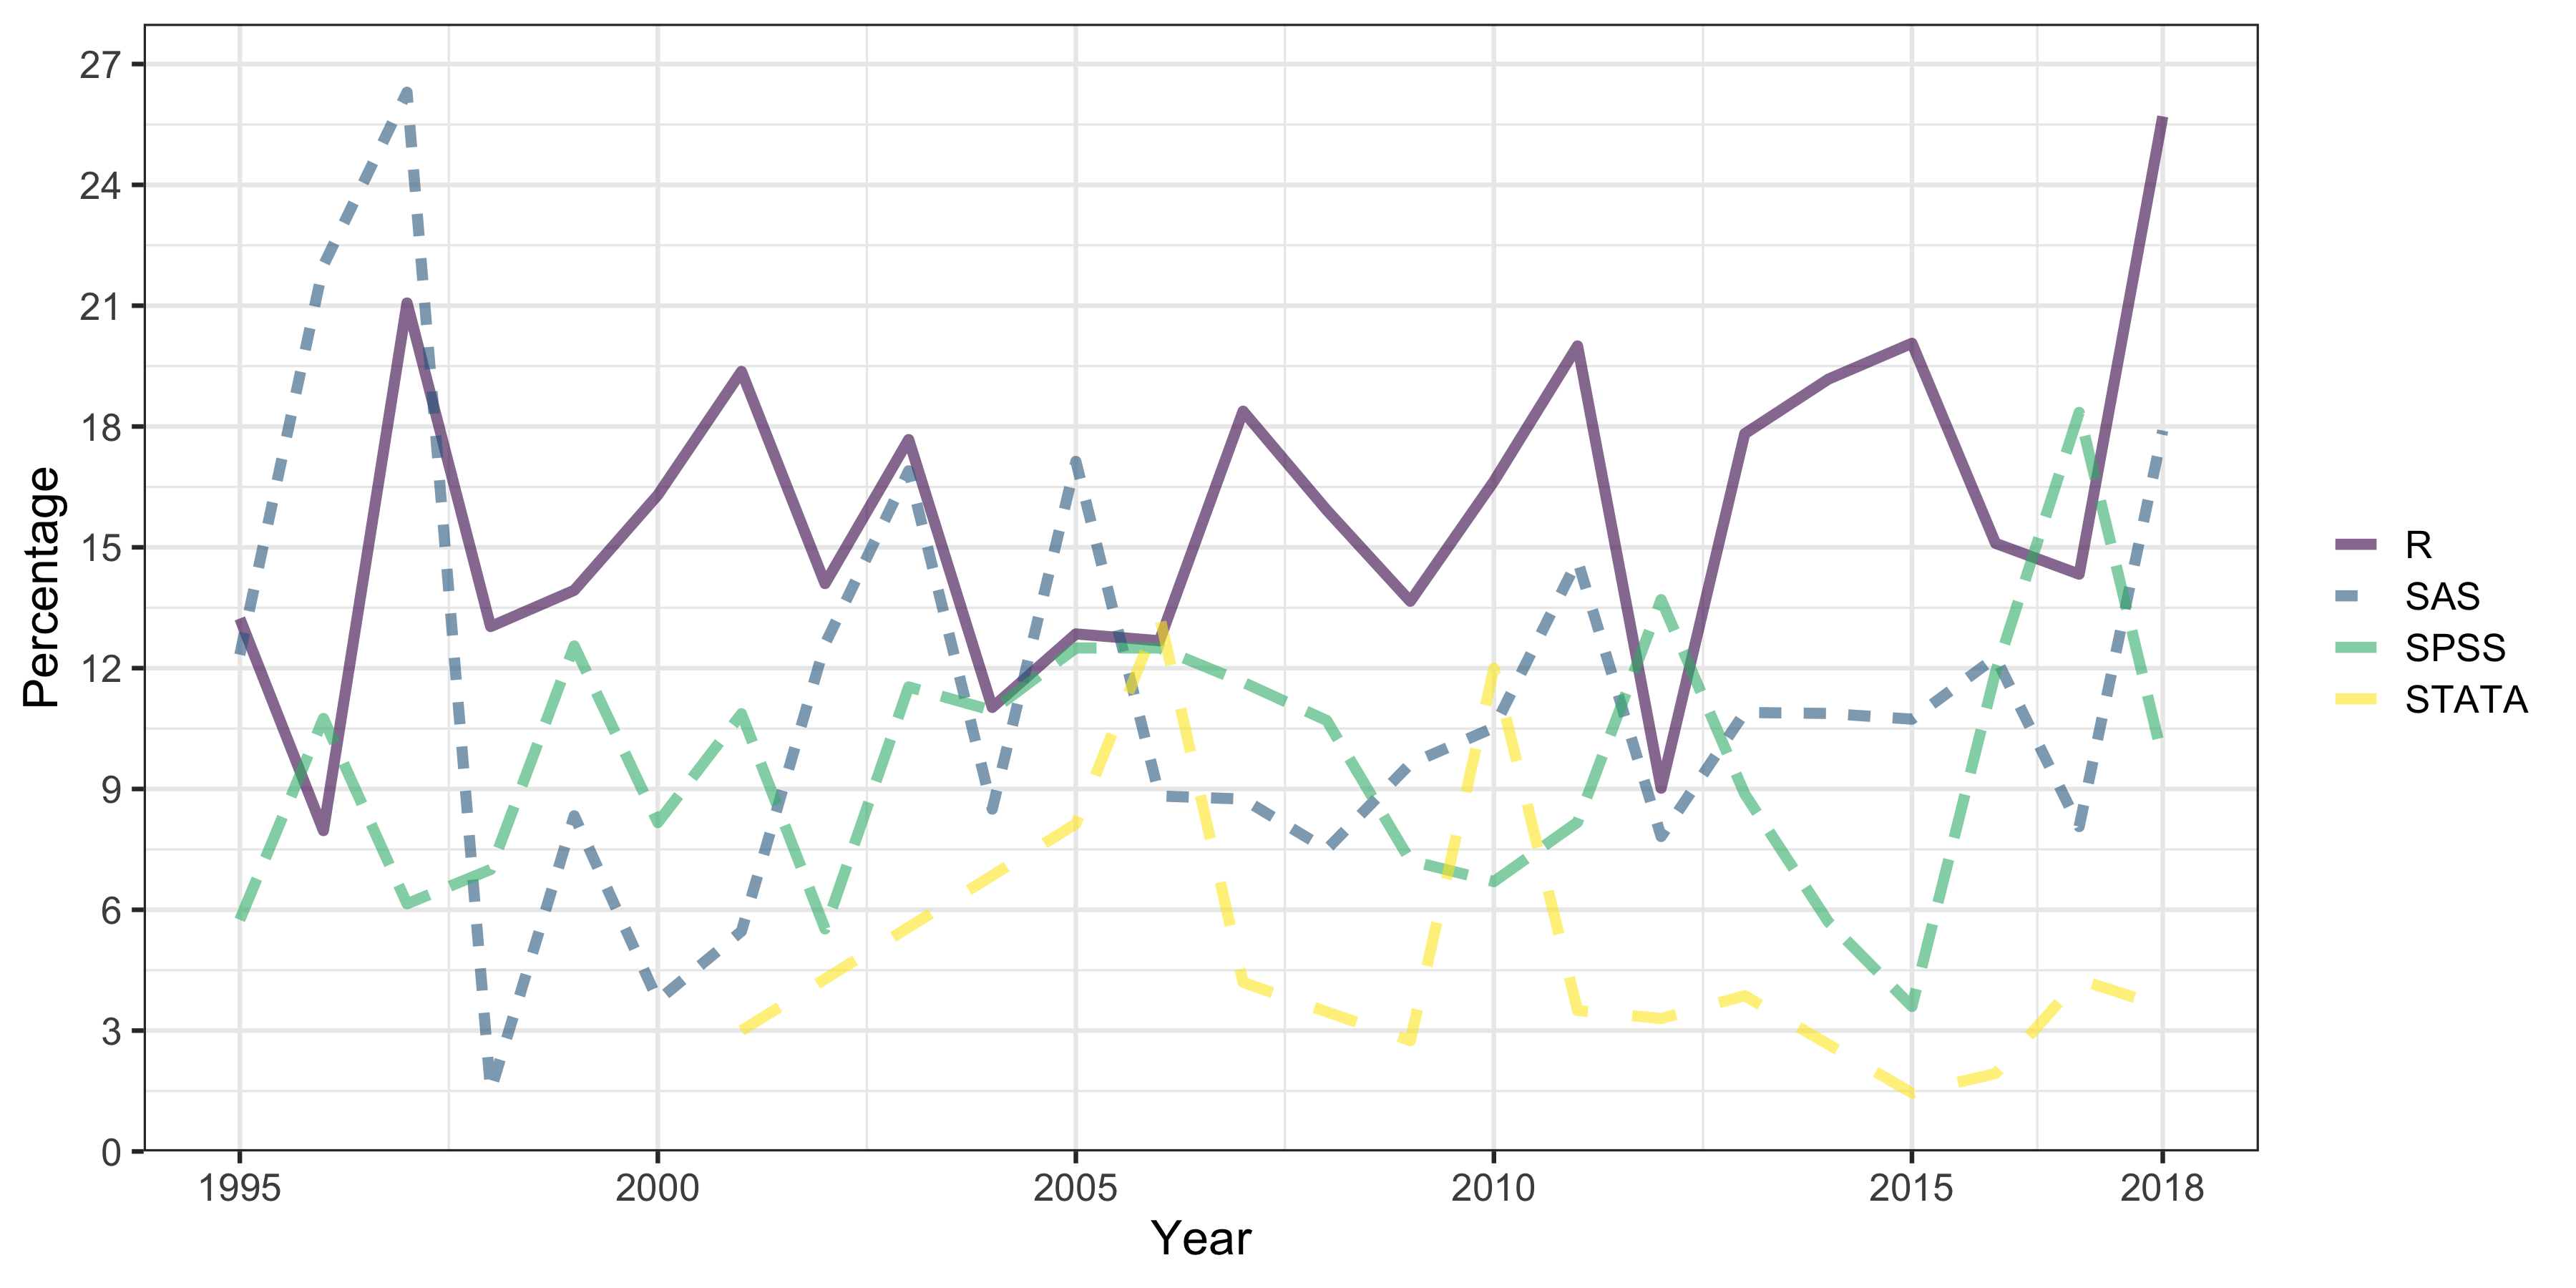
General Software Keyword Percentages by Year - Education
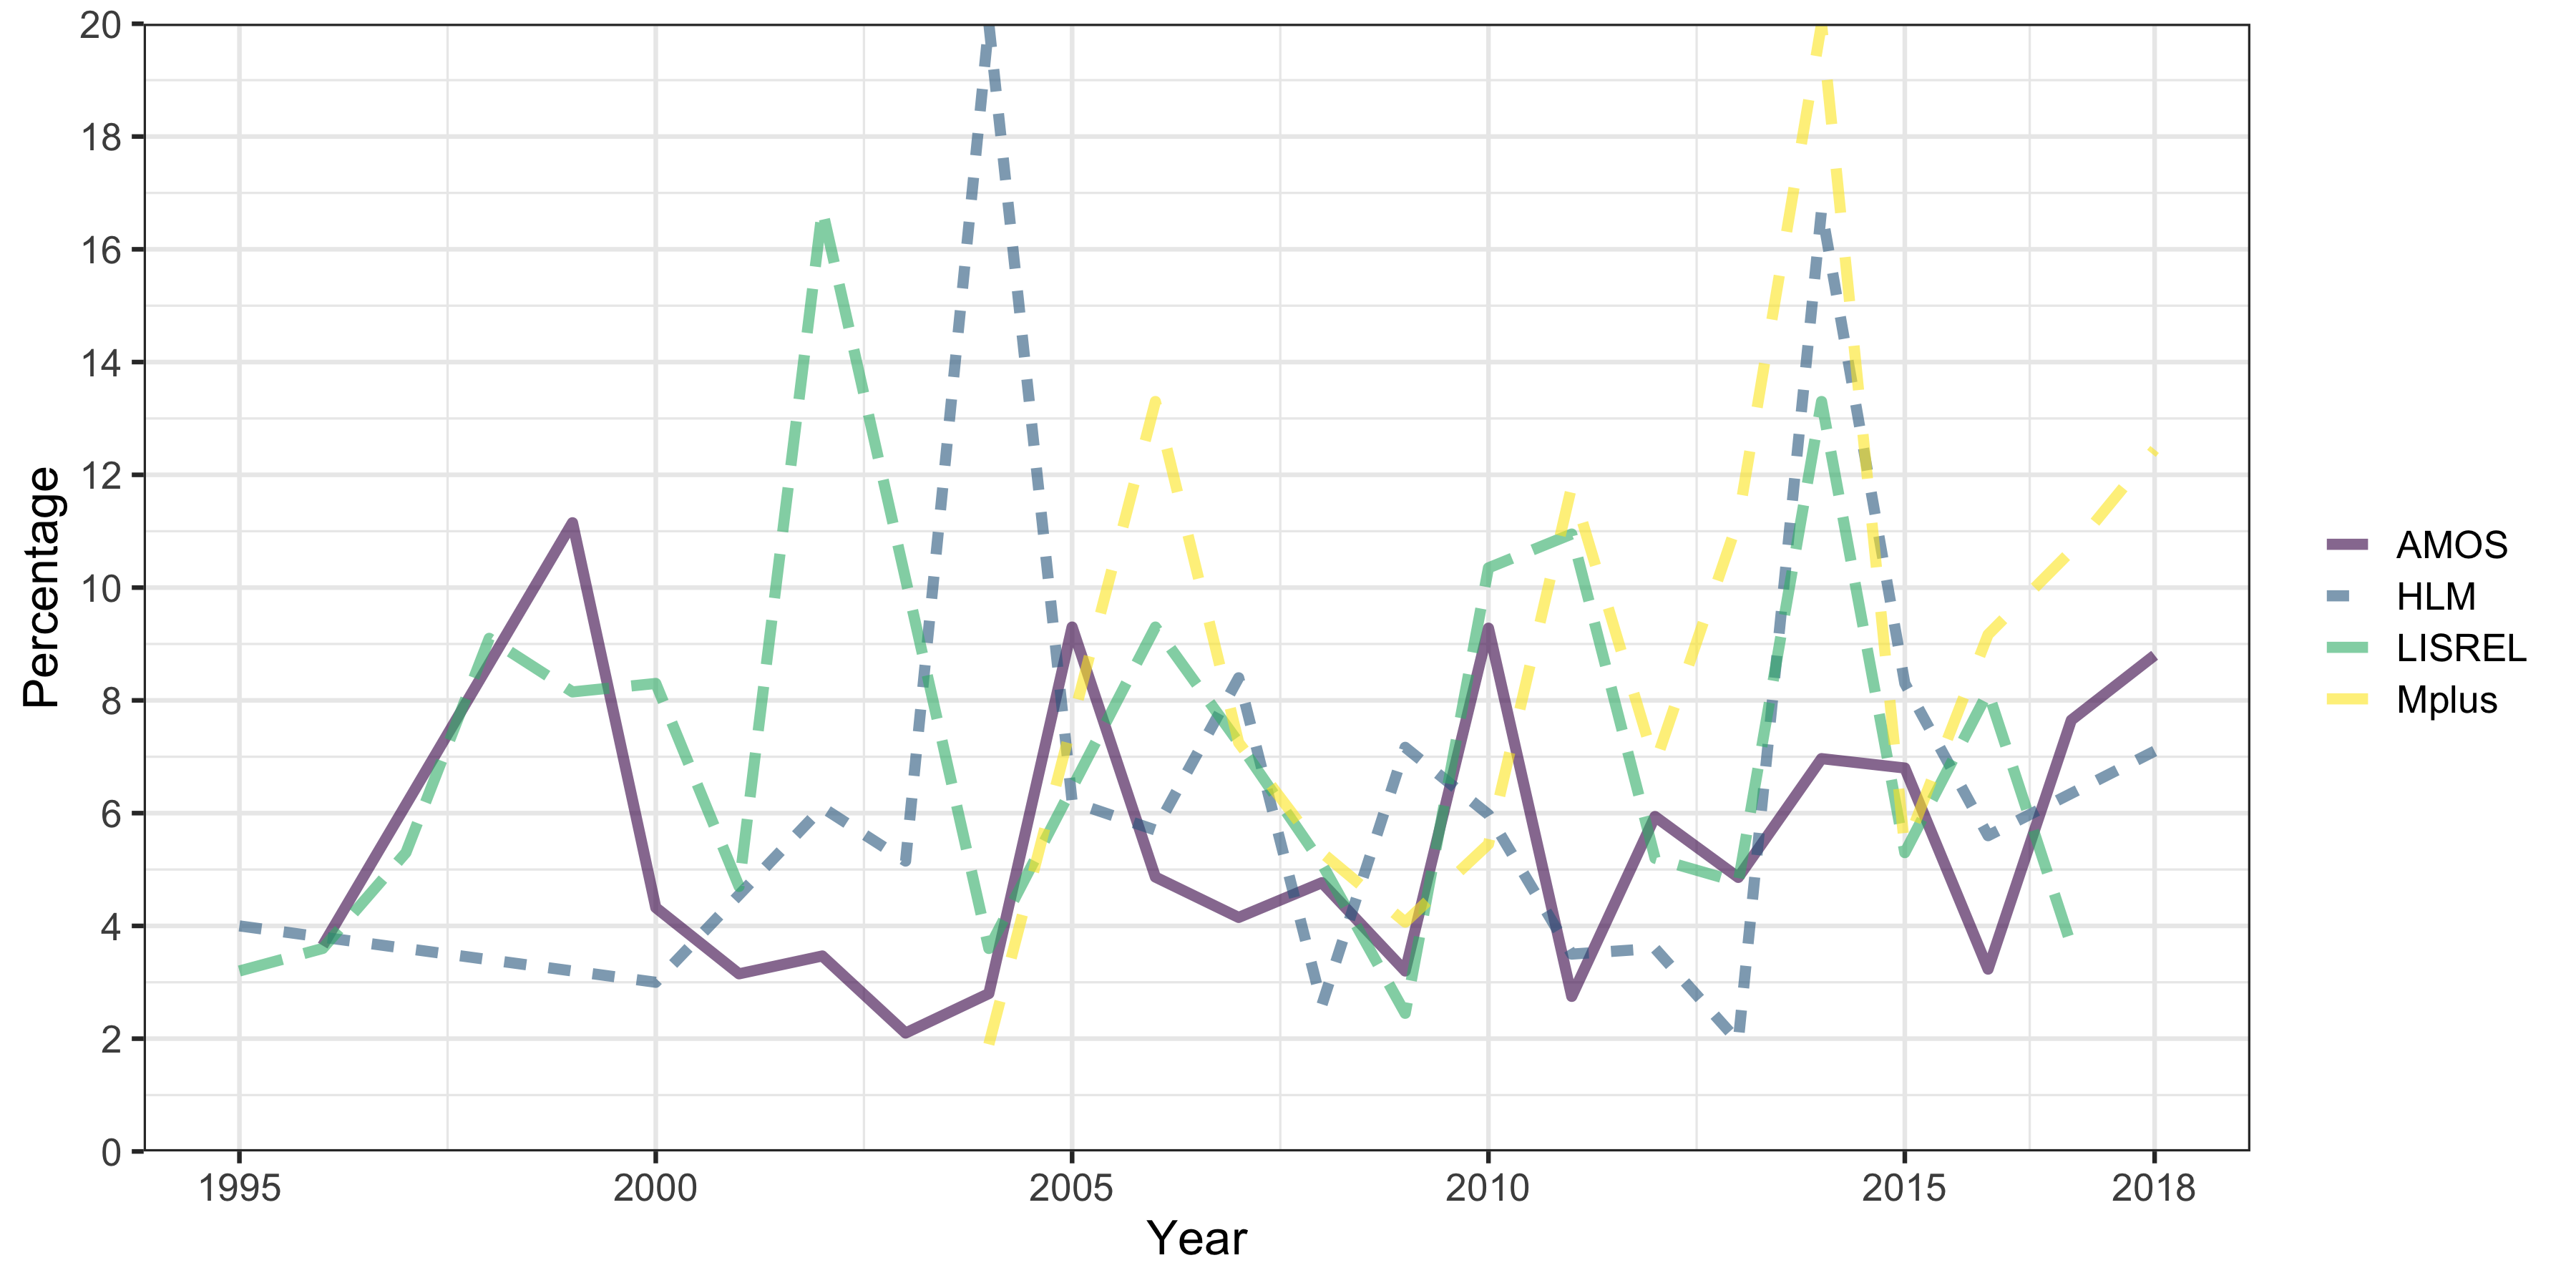
Specialty Software Keyword Percentages by Year - Education
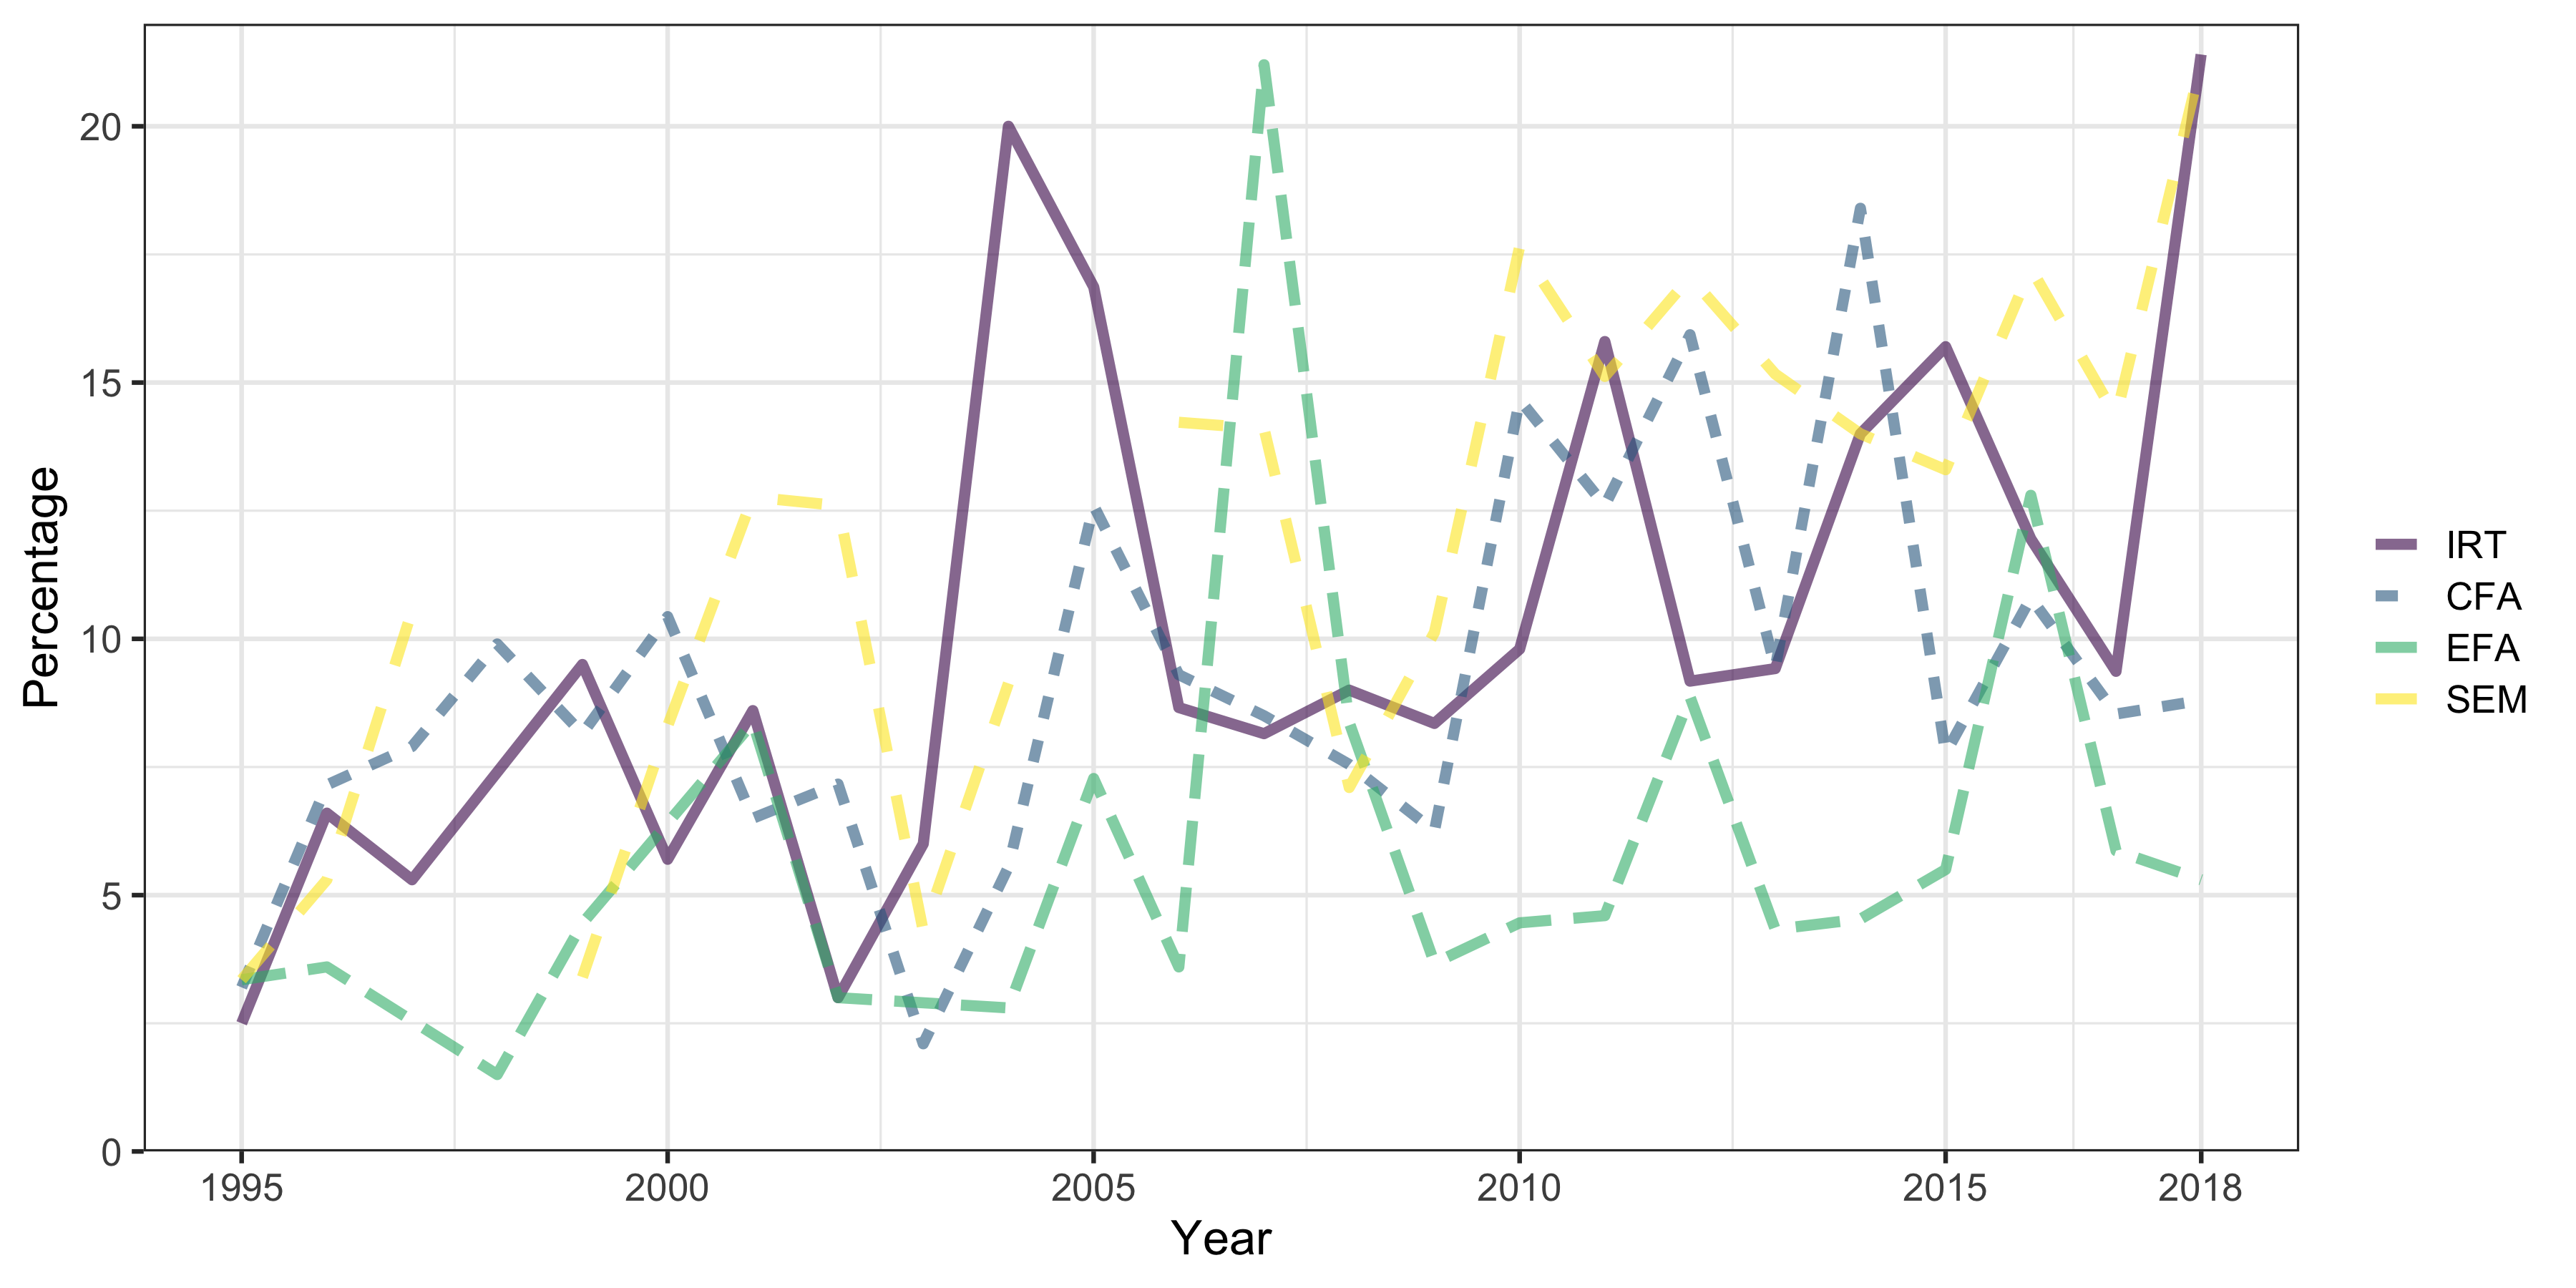
Analysis Keyword Percentages by Year - Education
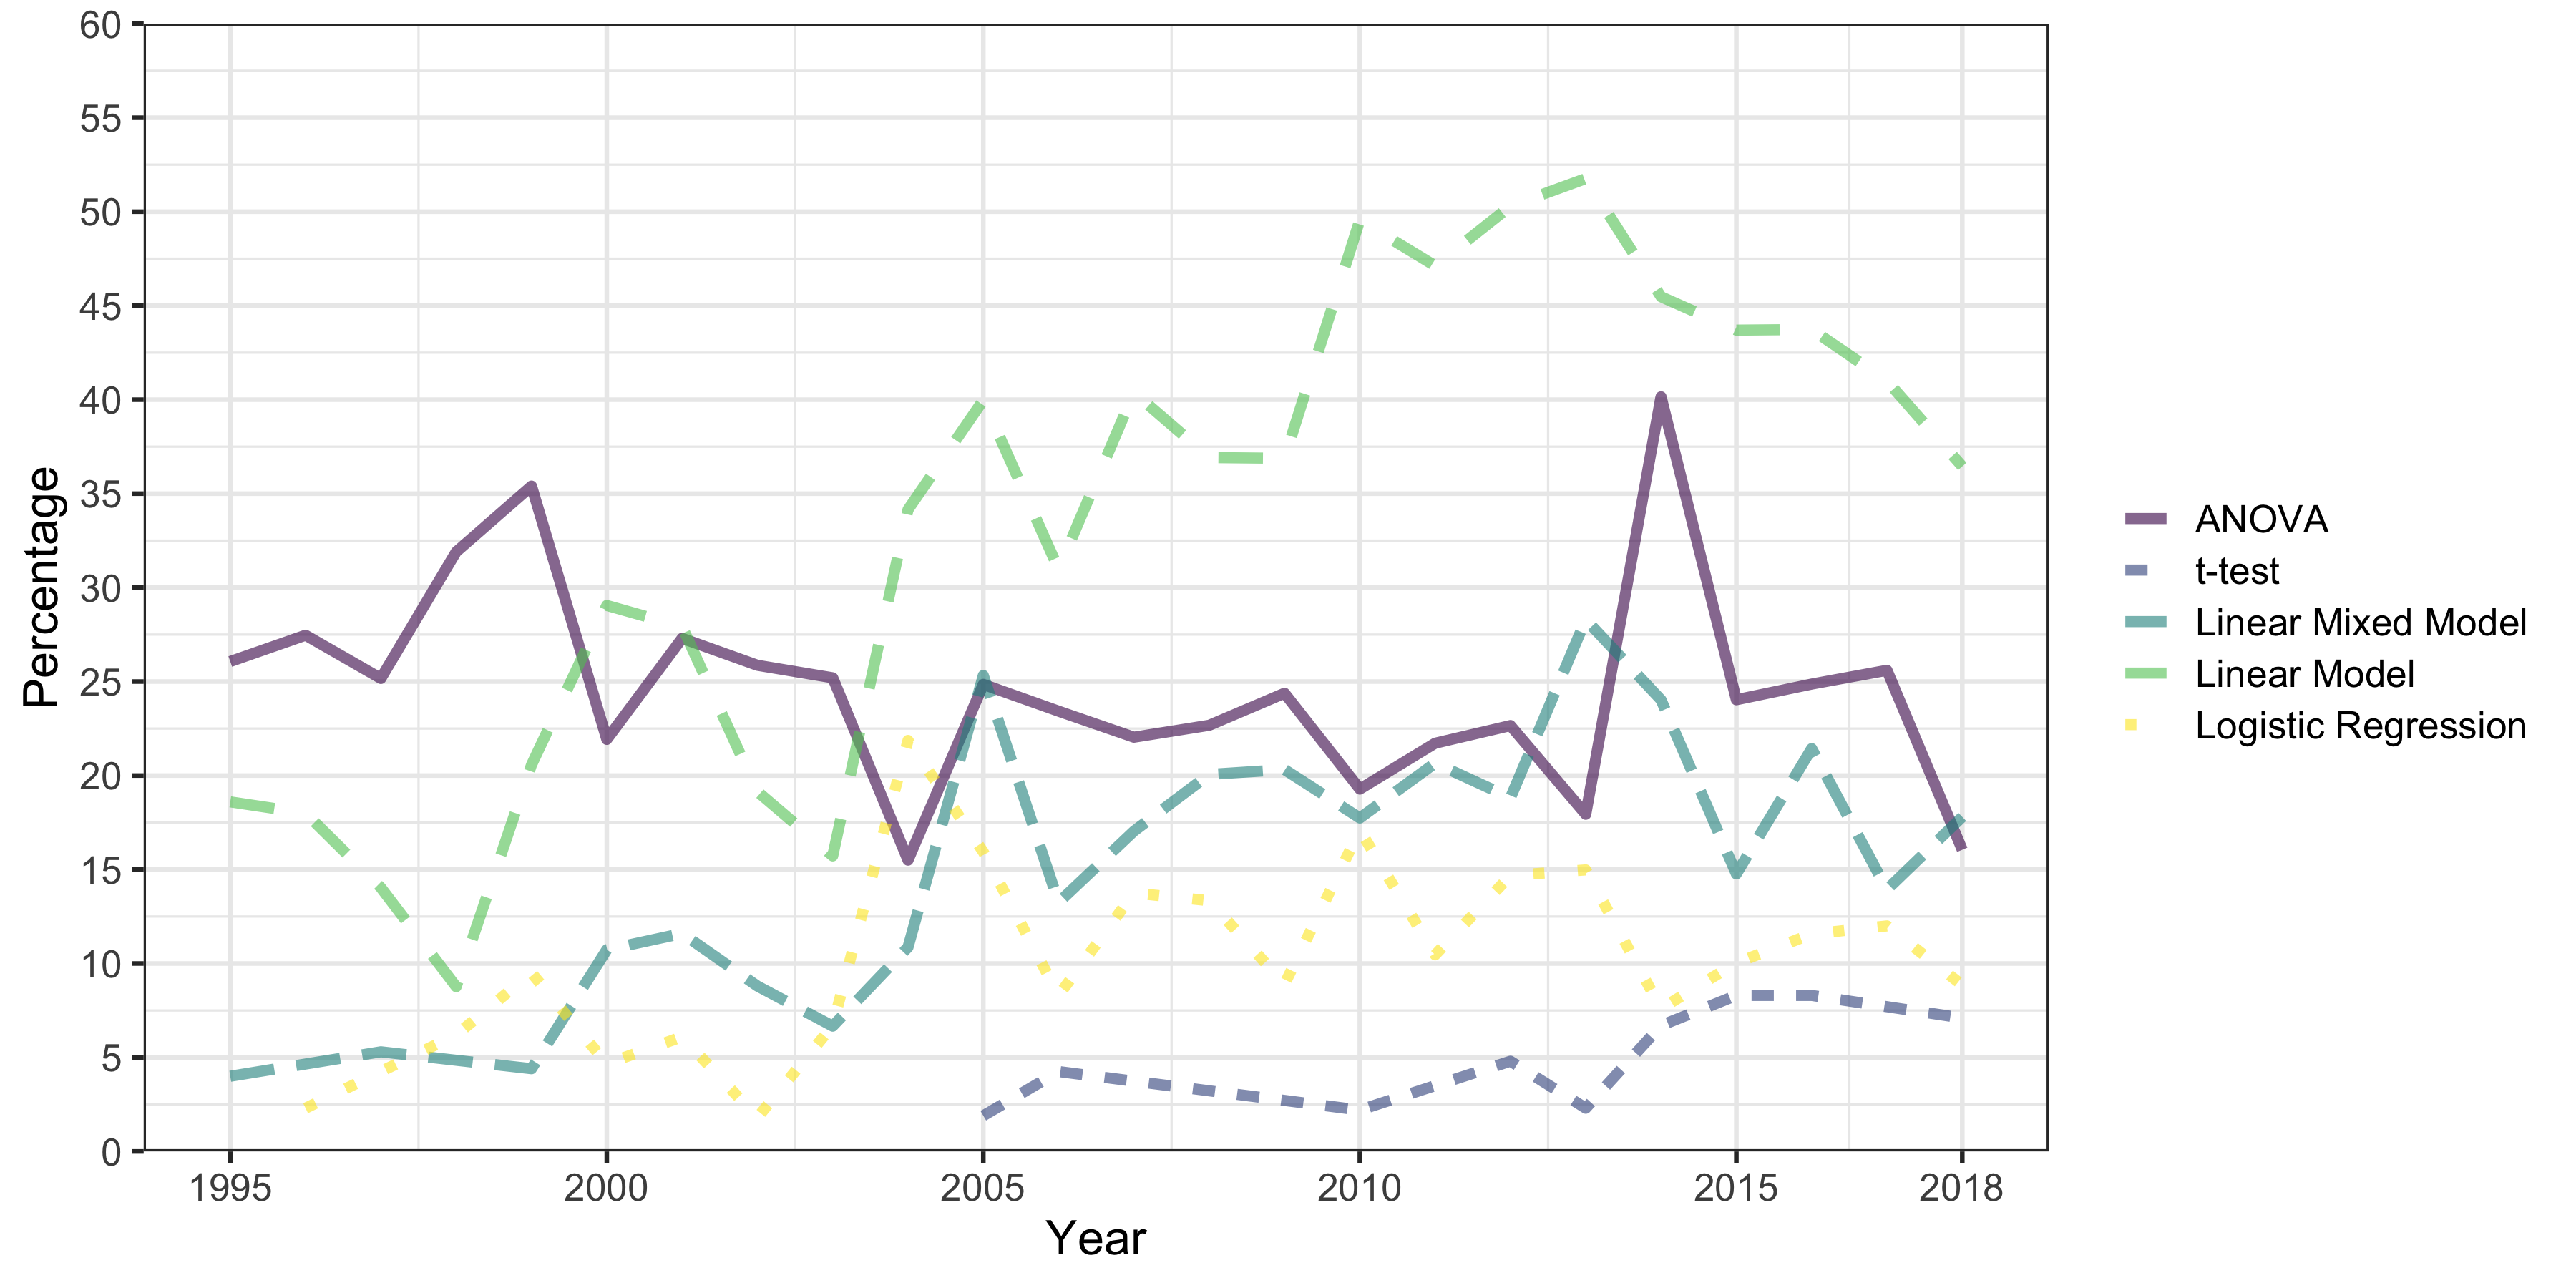
Analysis Keyword Percentages by Year - Education
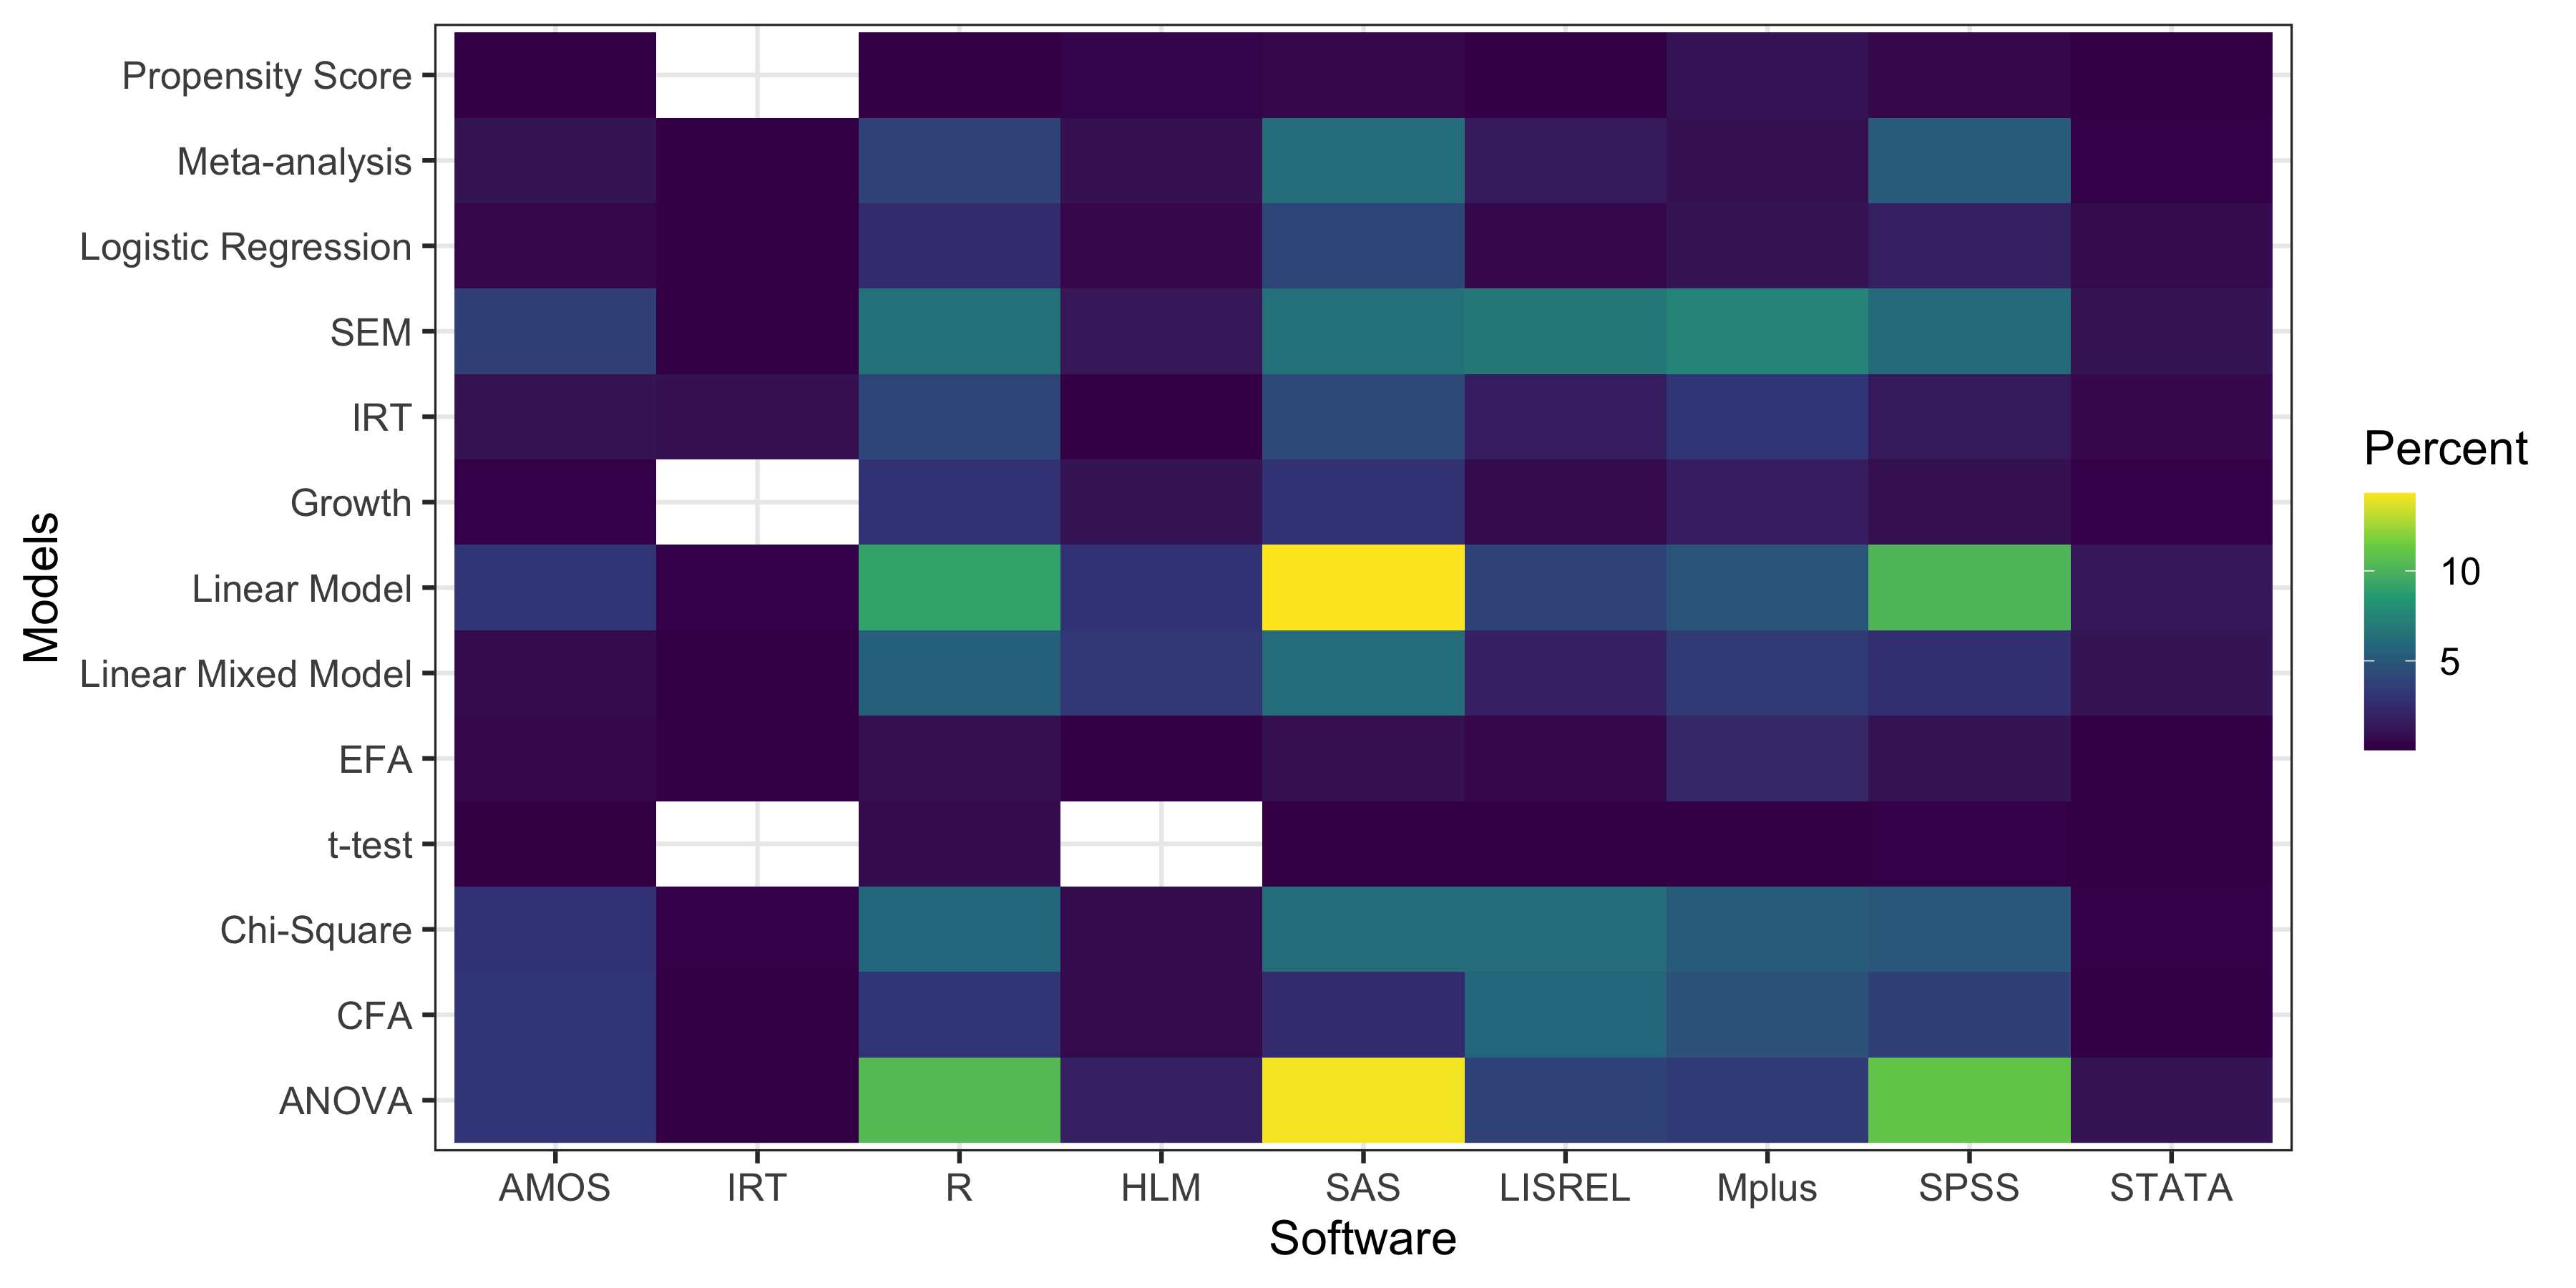
Interaction between Software and Analysis - Education
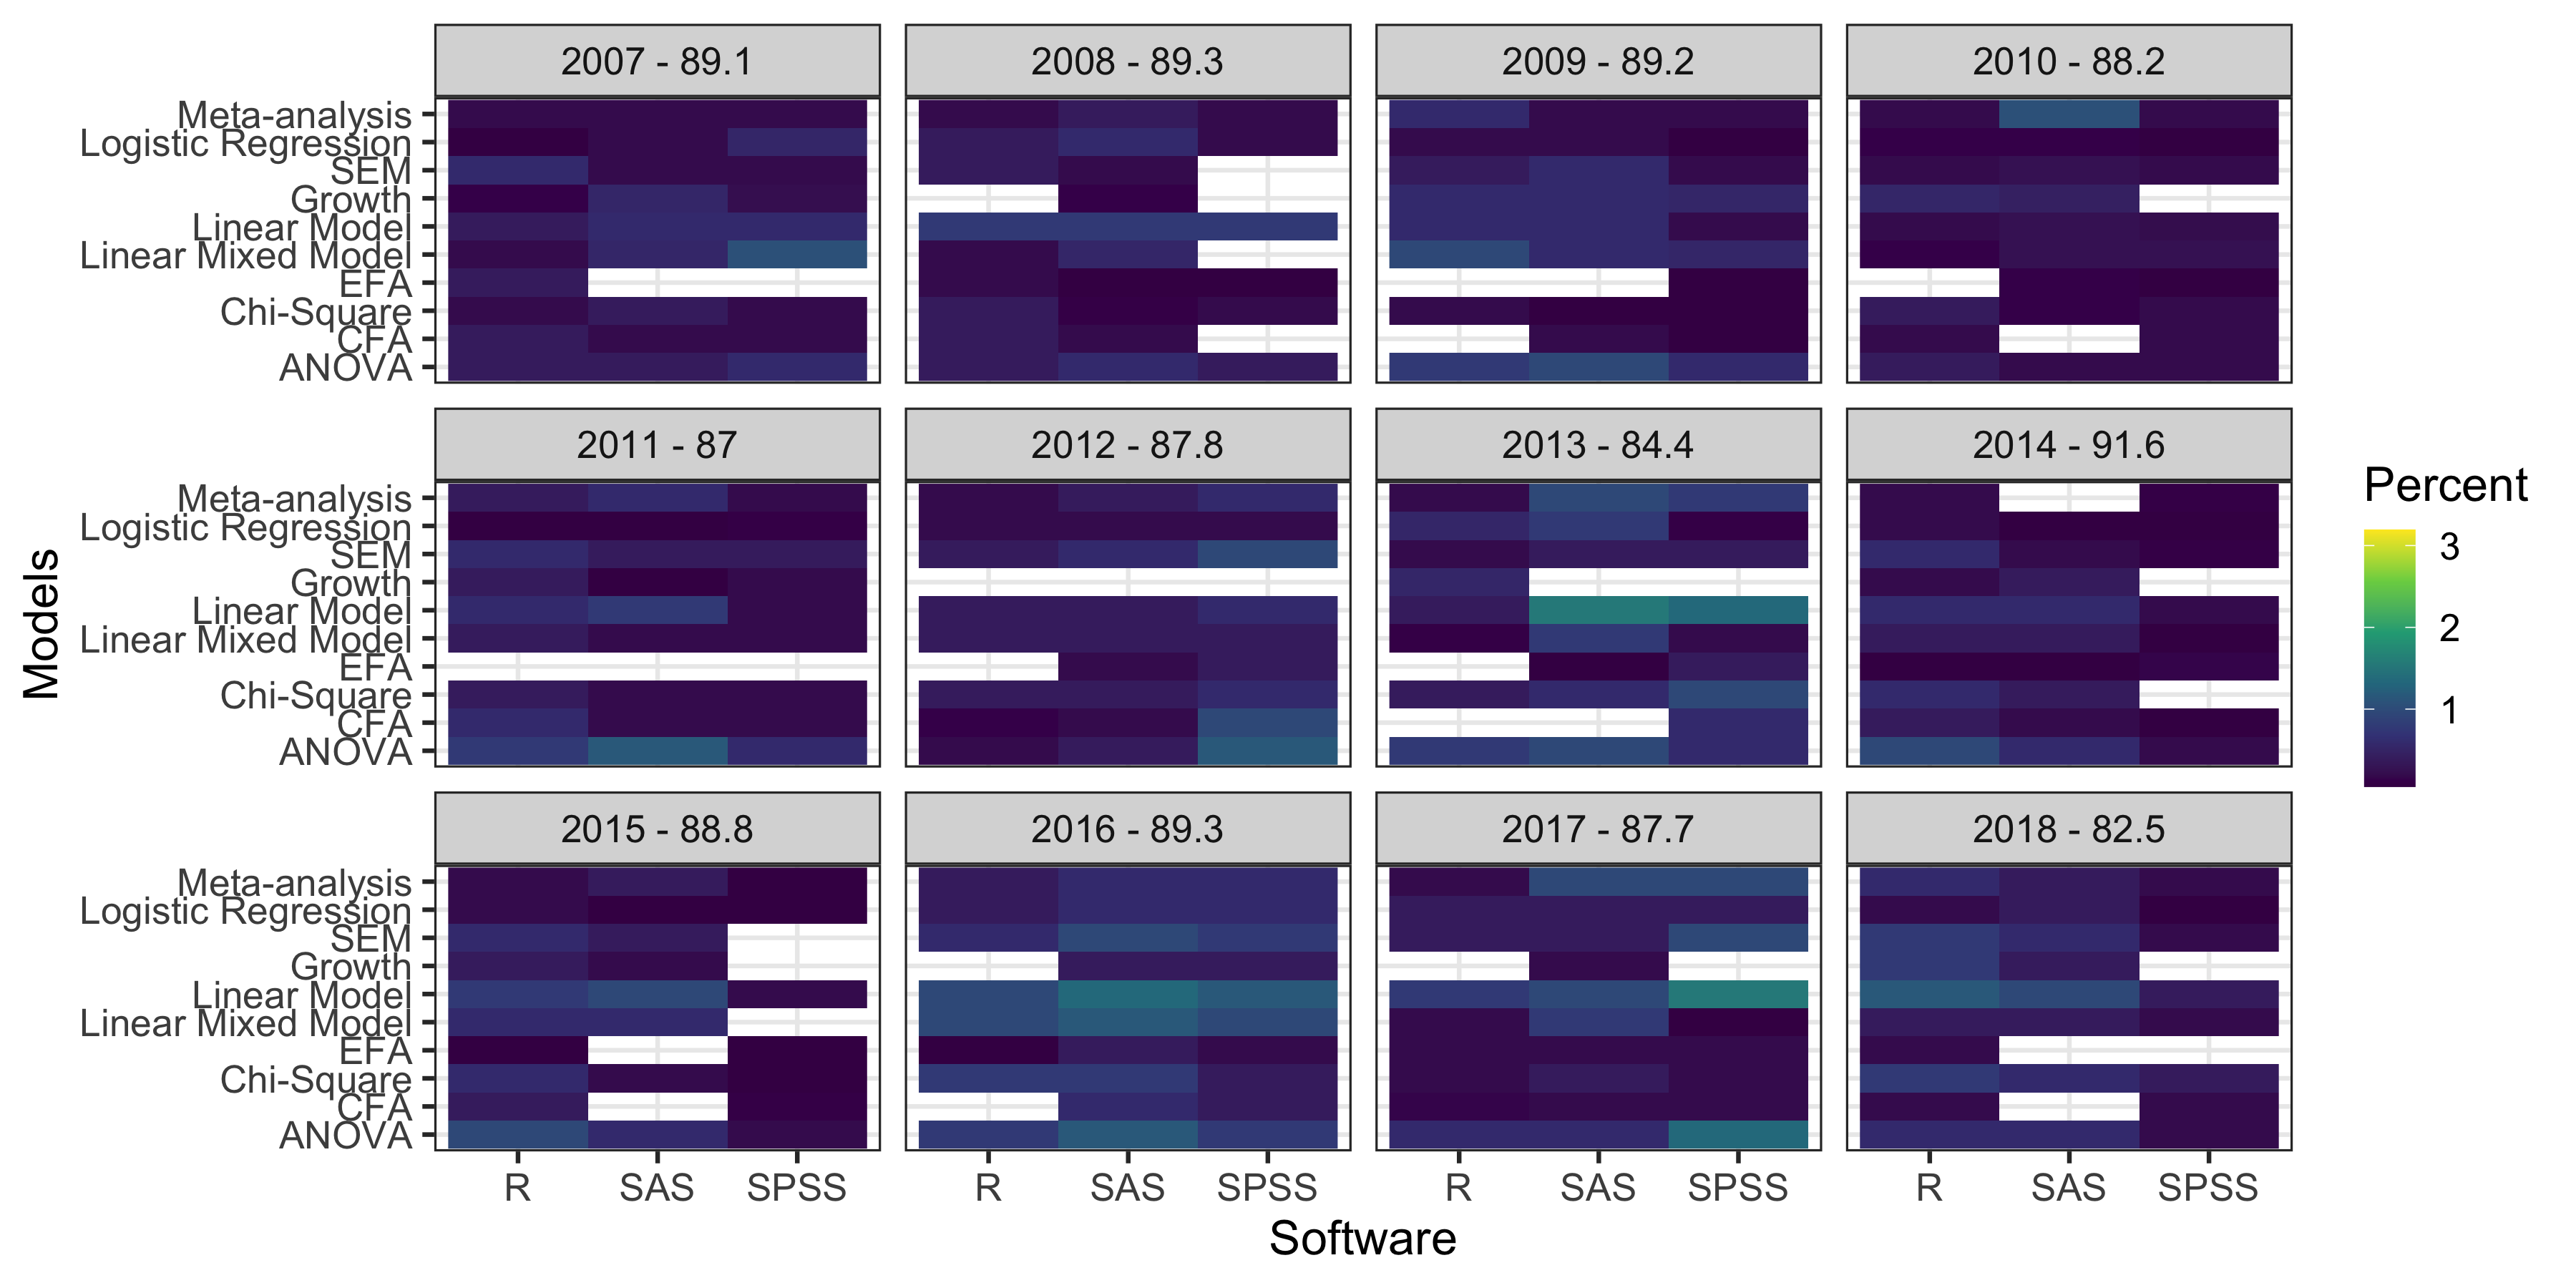
Interaction between Software and Analysis by Year - Education
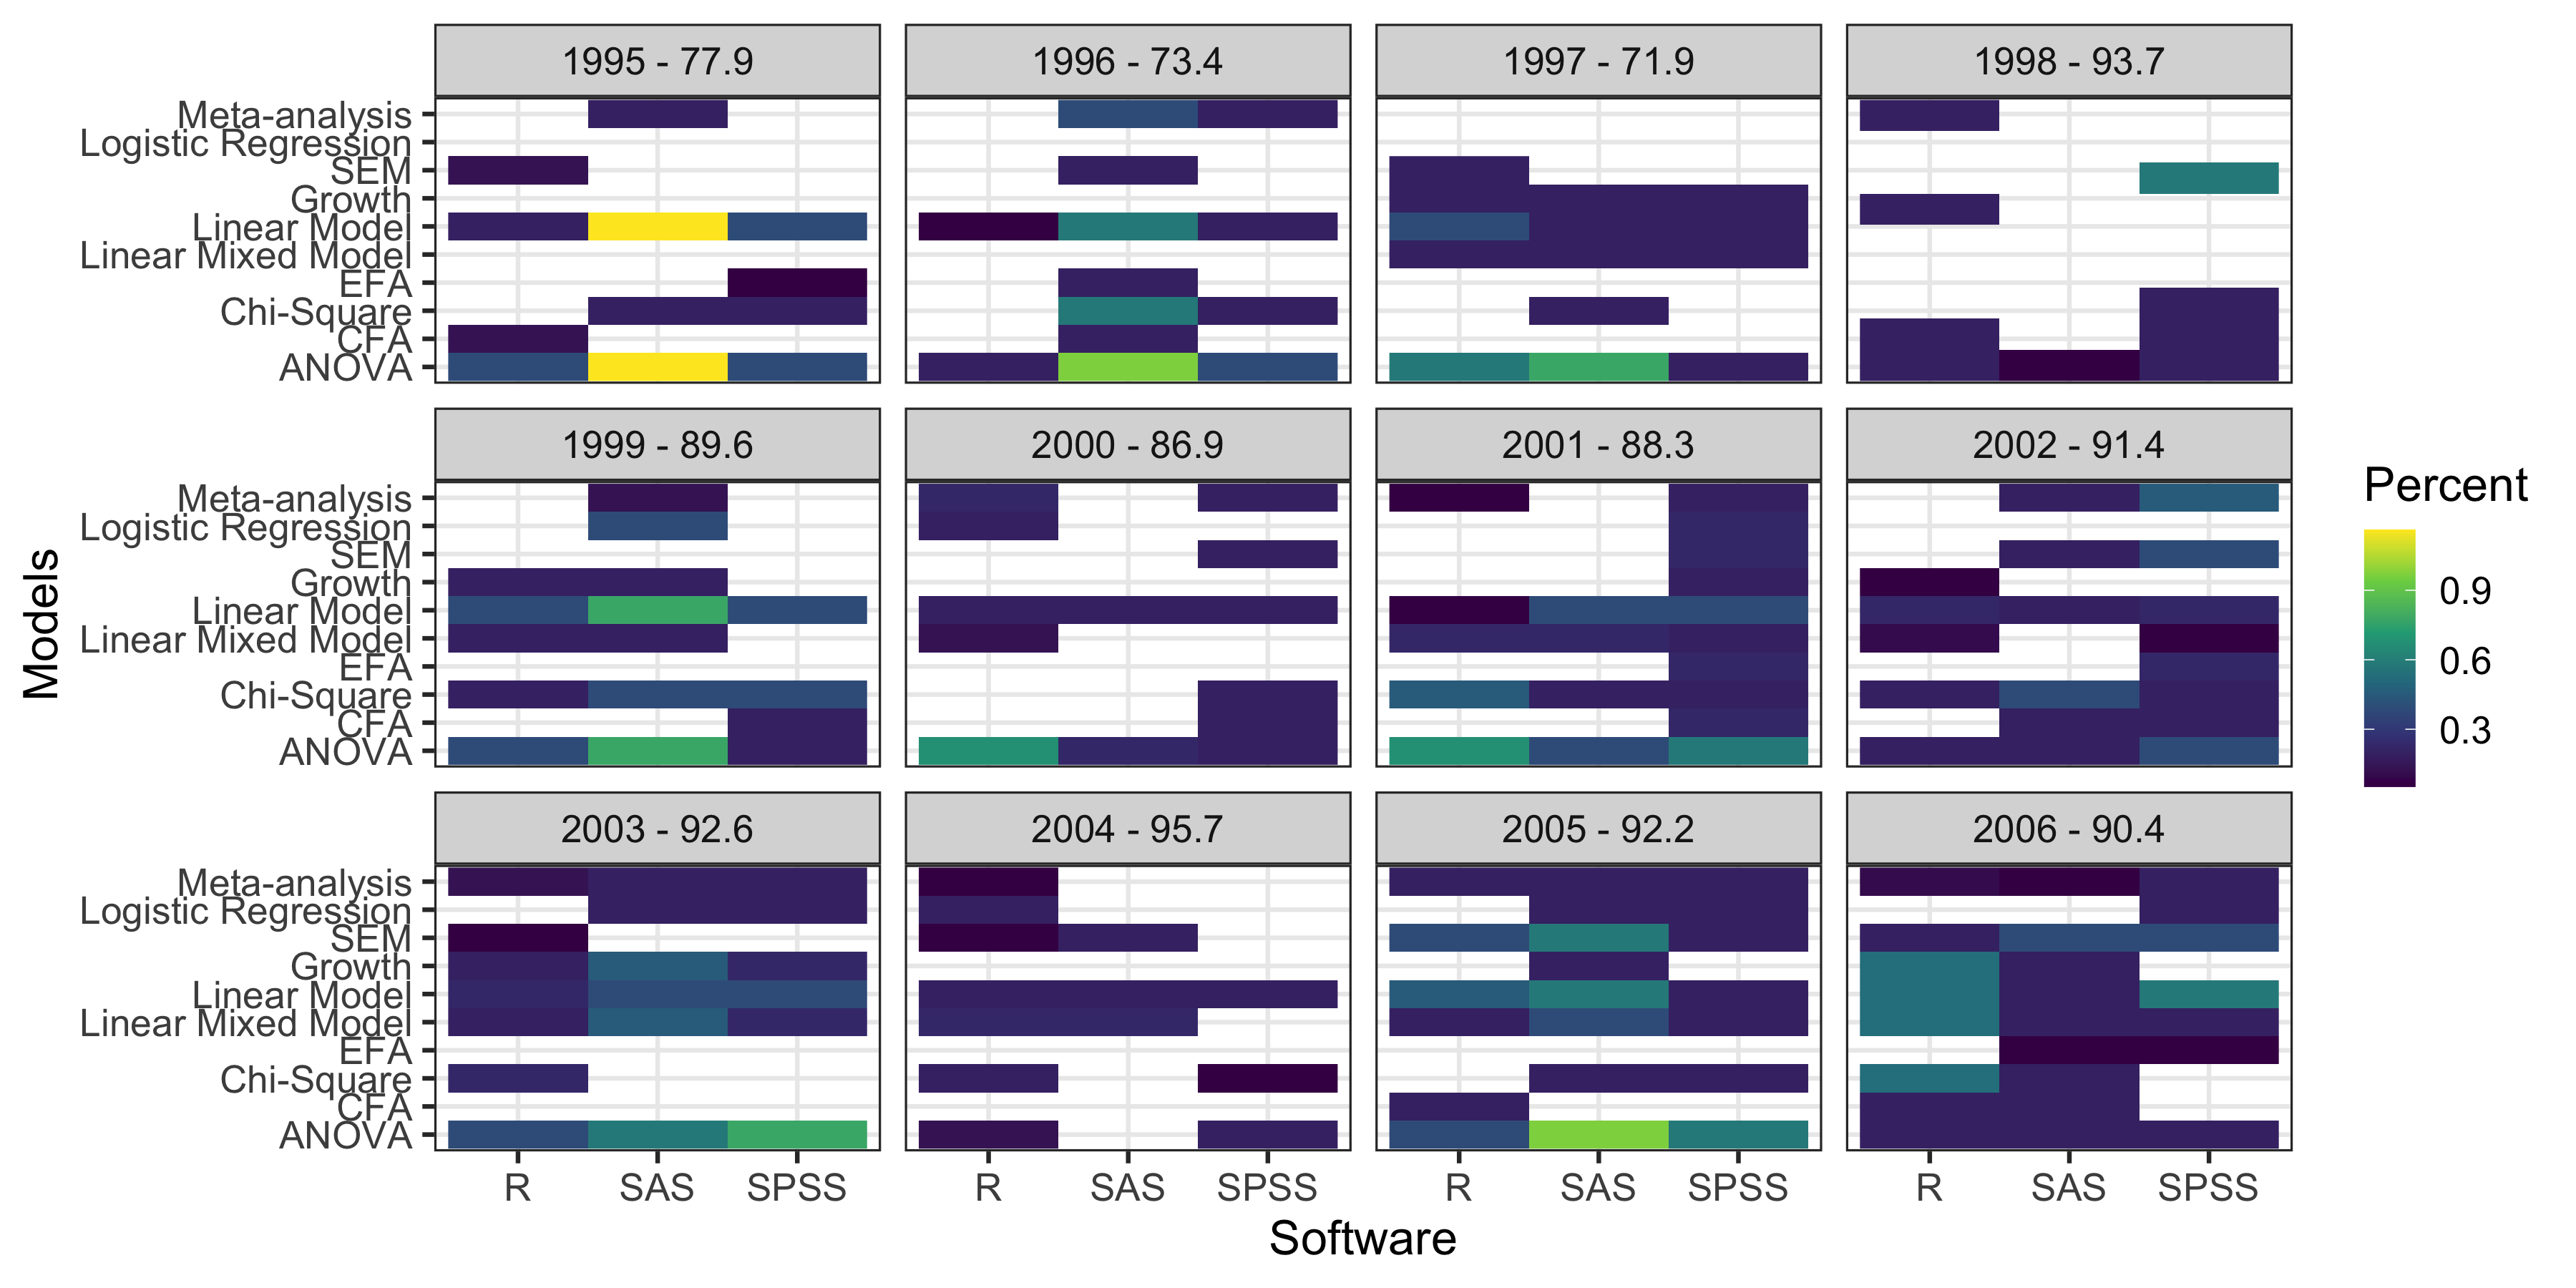
Interaction between Software and Analysis by Year - Education
Conclusions
- Cite the software you use!
- It benefits the software developer
- It benefits the reproducibility
- It benefits the replicability
- There are discipline/journal differences in methods and software used.
Connect
- slides: https://brandonlebeau.org/slides/canam2020/
- twitter: blebeau11
Evolution of Statistical Software and Quantitative Methods
Brandon LeBeau & Ariel M. Aloe
University of Iowa